In an evolving health landscape, emerging research continues to highlight concerns that could impact everyday wellbeing. Here’s the key update you should know about:
By analyzing co-abundance networks in 938 healthy adults, scientists discovered how lifestyle factors subtly rewire bacterial relationships in the gut, offering a more powerful way to predict health traits than abundance-based models.
Study: Cross and inter-family interactions for age, sex, smoking and BMI. Image Credit: Christoph Burgstedt / Shutterstock
In a recent study published in the journal Communications Biology, researchers investigated environmental factors associated with co-abundance in the human gut microbiome.
Complexity of the Gut Microbiome Ecosystem
A growing body of research has described features associated with the gut microbiome composition in health and disease. Some of the prominent features include sex, age, host genetics, and diet. However, some aspects of the host-microbiome relationship are difficult to characterize. The gut microbiome is a complex ecosystem, and its constituents form sub-communities through interactions between taxa.
Co-abundance and Functional Connectivity
The sub-communities exhibit co-abundances as they work together as a coherent functional group or exploit the same resources from the local environment. Exploring the co-abundance of taxa and the connectivity within the microbiome can help identify characteristics that univariate approaches would otherwise miss. However, there is no gold standard method for screening factors linked to changes in bacterial co-abundance across individuals within a population.
MANOCCA Method for Co-abundance Analysis
In the present study, researchers characterized associations between environmental factors and changes in the gut microbiome co-abundance network. First, Multivariate Analysis of Conditional Covariance Analysis (MANOCCA) was used to investigate the associations between 80 environmental factors (host features) and taxa co-abundance at the family, genus, and species levels using data from 938 healthy participants.
Associations Between Host Features and Co-abundance
This new method addressed key limitations of previous approaches by supporting both continuous and categorical predictors, allowing covariate adjustment, and providing a formal statistical framework for co-abundance at the individual level.
MANOCCA is a covariance-based approach that allows formal statistical testing of associations between the covariance of taxa and any predictor, and was developed to address current limitations.
Data on host features were collected at baseline and included demographics, medical history, dietary habits, and biomarkers. MANOCCA revealed significant associations with sex, age, and smoking at all three taxonomic levels and body mass index (BMI) at the genus level.
Network Structure and Interactions among Genera
Notably, associations with taxa co-abundance were enriched for nutritional features, indicating a modest but systematic impact of diet on the taxa interaction network.
Next, the team derived contribution weights for sex, age, BMI, and smoking signals, noting that most taxa had non-zero and substantially heterogeneous contributions to the association.
The MANOCCA weights were compared against univariate mean effect p-value associations derived from standard linear regression. This revealed a significant positive correlation between the two results for smoking, BMI, age, and sex, indicating a dual impact on the abundance and co-abundance of many genera.
A core of approximately 200 genera was systematically impacted across all four factors, suggesting a central role in the network structure. Next, the team analyzed the characteristics of the top 5% pairs of genera contributing the most to co-abundance variability at the family level. Among 151 families, 10, 8, 11, and 7 overlapping sets of families covered ≥ 50% of the top contributing genera for age, sex, smoking, and BMI, respectively.
The key families included Lachnospiraceae, Bacteroidaceae, Ruminococcaceae, Acutalibacteraceae, and Oscillospiraceae, with rare families such as Eggerthellaceae, Peptostreptococcaceae, and Muribaculaceae. Notably, Bacteroidaceae were underrepresented in co-abundance changes, whereas Oscillospiraceae were strongly impacted, particularly in relation to BMI.
The analysis also identified four co-abundance groups (CAG-74, CAG-508, CAG-272, and CAG-138) that contributed to the signal.
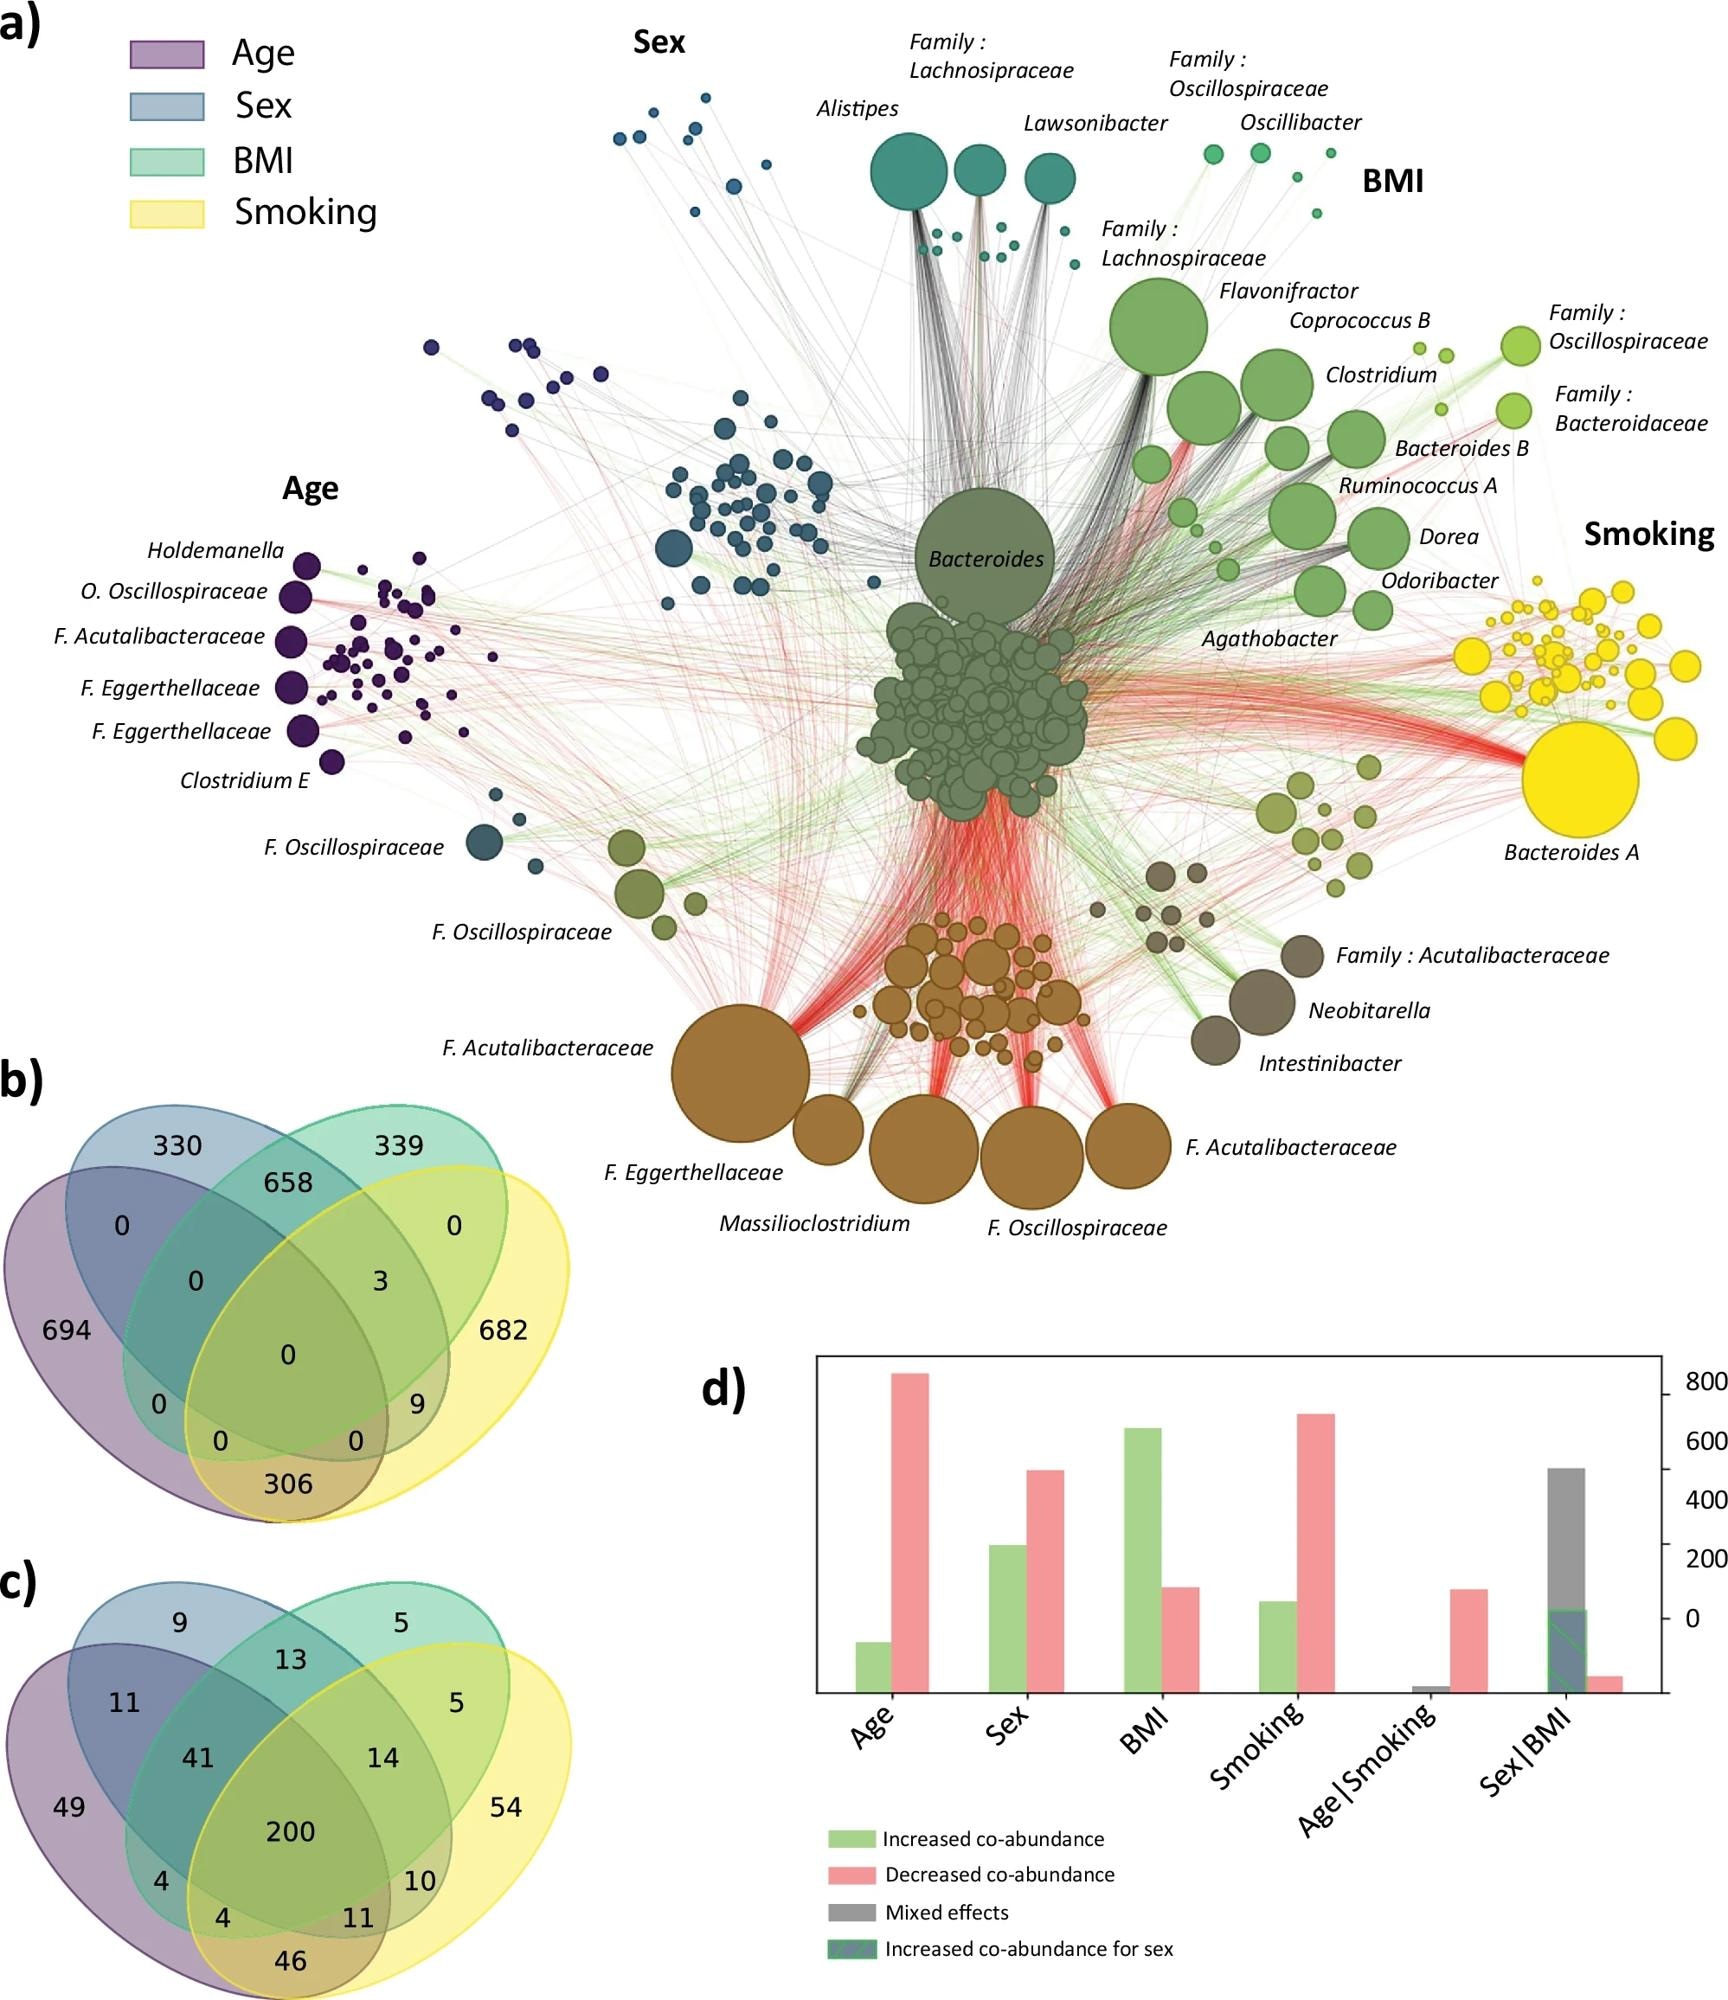
Cross and inter-family interactions for age, sex, smoking and BMI. For the top four associated features from the MANOCCA (age, sex, BMI and smoking), we extracted the top 1000 contributing pairs of genera out of the 259,560 total products and derived the direction of effect of each predictor on the pair of co-abundance. We plotted the Venn diagram of shared pairs between each feature in (a) and the overlap in taxa in (b). In (c), we show the distribution of direction of effects per predictor, and for the age – smoking and sex – BMI intersections. We then used the pairs of features to derive a network of the changes in correlation with regard to each predictor. The node size, representing a genus, is proportional to its number of contributions with other genera, and edges link the top contributing pairs. The edge colors indicate the direction of effect with green indicating that an increase of the predictor drives an increase in co-abundance, red shows that an increase of the predictor drives a reduction in co-abundance and black indicates a mixed direction of effect for the overlapping predictors. The color of each node depends on how it is shared across the four predictors, and follows the structure of the (b, c) venn diagrams. Panel (d) displays the number of edges included in a single predictor (Age, Sex, BMI, Smoking) and by overlapping predictors (Age and Smoking, Sex and BMI), with in red the edges of reduced co-abundances and in green increased co-abundances. Grey edges indicate a mixed direction of effects for the overlapping predictors. Specifically for the overlap between Sex and BMI, the hashed area represents edges towards increased co-abundance for Sex and decreased co-abundance for BMI. Conversely, the grey part covers a decrease for Sex but an increase for BMI.
Predictive Performance and Study Conclusions
Next, the team generated a network of co-abundance variation from the top 1,000 pairs of genera contributing to the MANOCCA association signal. In total, 4,000 pairs encompassed 476 unique genera.
Notably, the researchers observed a substantial overlap in pairs of co-abundant taxa that were impacted by both BMI and sex (658 shared pairs), as well as by smoking and age (306 shared pairs). Increased smoking and age were mainly associated with a decline in co-abundances, whereas higher BMI was associated with an increase.
Sex showed a mixed pattern. For example, Bacteroides A exhibited reduced co-abundances with many core taxa in smokers, despite no association in relative abundance, illustrating how covariance analysis can detect interaction shifts that are missed by traditional abundance-based methods. Finally, the team evaluated the accuracy of MANOCCA in predicting the most associated features (BMI, smoking, age, and sex) using taxa at the family, genus, and species levels.
Accuracy was determined using the area under the receiver operating characteristic curve and squared correlation (r²) for binary and continuous outcomes, respectively. The covariance-based prediction model was compared with a standard linear model based on relative abundance. The team noted that MANOCCA outperformed and was significantly more accurate than the standard model.
The gain in prediction was substantially large for age, with median r²(age) values of 0.18 (family), 0.25 (genus), and 0.27 (species) for MANOCCA models, representing a three-fold improvement over abundance-based models.
The corresponding r²(age) estimates from the standard model were 0.05, 0.07, and 0.10, respectively. Prediction was significantly higher for sex at all taxonomic levels for MANOCCA.
Broader Implications and Future Applications
In summary, the study examined the relationships between host characteristics and the co-occurrence of the gut microbiome in healthy individuals. MANOCCA revealed significant associations between the variability in taxa co-abundance and age, sex, BMI, and smoking.
The network of top-contributing genera revealed that interaction variability was limited to a small number of families. Co-abundance variability was concentrated in a limited number of families, with cross-family interactions vastly predominating over within-family links. Moreover, interactions were primarily observed between genera of distinct families, rather than within the same family.
The MANOCCA framework can also be utilized to develop predictive models. The predictive power of taxa co-abundance-based models was significantly higher than that of a standard abundance-based model for all features. However, the authors noted that the MANOCCA method requires large sample sizes (typically over 100 participants) and does not explicitly model the compositional nature of microbiome data, which should be refined in future work.
Journal reference:
- Boetto C, Romero VB, Henches L, et al. (2025). The influence of environment on bacterial co-abundance in the gut microbiomes of healthy human individuals. Communications Biology, 8(1), 1537. DOI: 10.1038/s42003-025-08895-y, https://www.nature.com/articles/s42003-025-08895-y