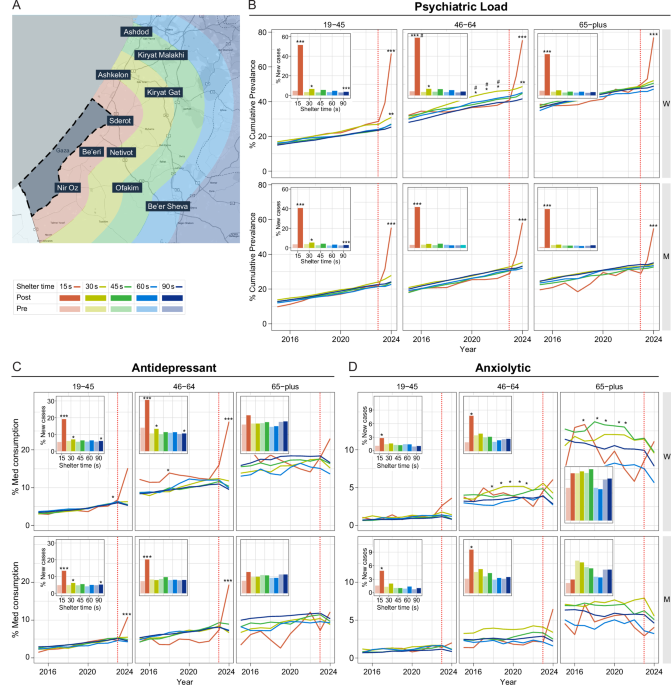
A cohort of active Leumit HMO members comprised of 208,625 was split by shelter time, as depicted in the map (Fig. 1A), as well as by age groups and sex (Supplementary Table 1). Longitudinal analysis of prevalence rates of psychiatric load demonstrated that prior to October 7, CTS-exposed 30 s women ages 19–45 and 46–64, had significantly higher psychiatric load than 90 s areas (Fig. 1B, top left and center, respectively) during 2015–2024 (p < 0.001, 19–45, 46–64, 30 s vs 90 s). Additionally in all years and in age groups, women had higher prevalence then men (p < 0.001, 2015–2024, 19–45, 46–64, 65+, 15 s women vs men, 30 s women vs men, 90 s women vs men). Surprisingly, these 30 s exposed women ages 46–64 had up to 46% prevalence for psychiatric load, significantly higher than their 15 s counterparts (p < 0.01, 2021–2023 15 s vs 30 s).
After October 7th, (Fig. 1B) a significantly effect was observed in the 15 s group, in both men and women of all ages. In addition, a moderate yet significant increase was noted in other exposure areas. 15 s women aged 46–64 surpassed 30 s women in psychiatric load rates of 66% and 42% respectively (p < 0.001, 15 s vs 90 s; p < 0.001, 30 s vs 90 s, p < 0.01,15 s vs 30 s). A significant increase in women and men 19–45 and 46–64 in all shelter times, even in low exposure, is observed in a exposure gradient manner when comparing the baseline of % new cases of psychiatric load pre-Oct 7th vs post-Oct 7th (Fig. 1B, upper left, inset) within the same shelter time (15 s pre vs 15 s post, 19–45, 36% increase, p < 0.001; 19–45, 30 s pre vs 30 s post, 4% increase, p < 0.01; 90 s pre vs 90 s post, 2% increase, p < 0.001). Overall, 30 s women 46–64 were most vulnerable to mental health effects of CTS, while after added acute events, both men and women were vulnerable proportionately to the intensity level.
Next, we examined medication use in CTS to confirm the findings of the psychiatric load. Antidepressant prescriptions (Fig. 1C) were the most abundant of any drug class and were already consumed significantly higher in 15 s due to CTS, 5% in women 46–64 (2018, 15 s vs 90 s, p < 0.05). After October 7th (Fig. 1C left and center, insets), we observed a significant increase of 14% and 17% in the 19–45 and 46–64 age groups, respectively in 15 s women (15 s pre vs post, p < 0.0001) and an increase of 13% in 15 s men 46–64 (15 pre vs post, p < 0.001) (Fig. 1C, center, inset). 30 s and 90 s exposed groups had more modest, yet significant, increases within shelter time (30 s pre vs 30 s post, p < 0.05, 90 s pre vs. post, p < 0.01).
Use of anxiolytics (Fig. 1D, center) increased after Oct 7th in 15 s, 46–64 aged men (15 s pre vs. post, p < 0.05), and women (15 s pre vs. post, p < 0.001). 30 s women already had 3% higher rates from 2017–2022 (46–64, 65+ p < 0.05 30 s vs 90 s). For Anti-psychotics, hypnotics and see Supplementary Text and Figures.
Immune dysregulation was then assessed by examining prevalence rates of bacterial pneumonia and autoimmune disorders diagnosed per shelter time. Specifically, we looked at prevalence rates of bacterial pneumonia, a lung infection caused by an acute bacterial secondary infection in those with weakened immune systems. While older age groups are particularly vulnerable, 15 s 46–64 groups had higher prevalence rates that 90 s. 15 s women 46–64 (Fig. 2A top, center) had up to 5–6% higher prevalence, (2018–2022, 15 s vs 90 s, p < 0.0001), while 15 s men aged 46–64 (Fig. 2B, bottom, center), had a peak of 16% prevalence in 2019 (15 s vs 90 s, p < 0.0001), and of up to 8% higher than low exposure areas in 2008–2009 (15 s vs 90 s, p < 0.00000 15 s vs 30 s, p < 0.0001), demonstrating a vulnerability to this acute immune illness particularly in high exposed men.
A Prevalence rates of bacterial pneumonia, in 15 s residents ages 46–64, were 6% higher in women (top, center panel) 2018–2022 p < 0.001,and men (lower, center panel) in 2019 (15 s vs 90 s, p < 0.001) with peak of 16% prevalence in 2019, and of up to 8% more than low exposure areas in 2008–2009 (15 s vs 90 s, p < 0.001 15 s vs 30 s, p < 0.001). B. Significantly higher prevalence rates of organ-specific autoimmune disorders, up to 26%, were observed in women 19–45 (top, left panel) and 46–64 (top, center panel) higher than both high and low exposed women in 2014–2016 (46–64, 30 s vs 90 s, p < 0.001, 15 s vs 30 s, p < 0.01, “#”) and in 2018–2019 (19–45, p < 0.001, 30 s vs 90 s).
Significantly higher prevalence of chronic, organ-specific autoimmune disorder (Fig. 2B) rates of up to 26% were observed 30 s women; in women 19–45 there were peaks in years 2018–2019 compared to 90 s (p < 0.001, 30 s vs 90 s) and in women 46–64 there were significant differences when compared to both 15 s and 90 s groups exposure in 2014–2016 (30 s vs 90 s, p < 0.001, 15 s vs 30 s, p < 0.01). Prevalence in women in general was significantly higher than men in 19–45 and 46–64 age groups in all years (2005–2024, p < 0.001, 15 s women vs men, 30 s women vs men, 90 s women vs men) indicating the sex-specific impact of moderate CTS on autoimmune disease in women. No acute effects of October 7th were observed in both acute and chronic illnesses, however, increases in prevalence may take years and not months to observe.
Standard laboratory blood test results were next examined to determine use as possible biomarkers of stress exposure and disease progression. All values were in the clinically healthy range, but white blood cells (WBC) levels (Fig. 3A) different significantly elevated in 15 s compared with other regions in earlier years of escalation. Specifically, WBC levels in men ages 46–64 in 15 s showed significant elevations and small effect size compared with 90 s group (15 s vs 90 s, 2007, p < 0.001, d = 0.32), but also men 65+ also had with significantly higher levels with a moderate effect size (15 s vs 90 s, 2005 p < 0.0000, d = 0.56) and men 19–45 had elevation in years with escalation in rocket fire (15 s vs 90 s, 2008, p < 0.01, 2014-p < 0.001; 2018; p < 0.01, d = 0.32). In contrast, mean corpuscular volume (MCV) levels were elevated significantly, in 30 s exposed women and 30 s men in all years in 19–45 and 46–64 compared to 90 s counterparts, (women: 30 s vs 90 s, 19–45, 2005–2024, p < 0.01; 46–64, 2005–2024 p < 0.01, d = 0.20 (men: 30 s; 19–45, 46–64, 30 s vs 90 s, 2005–2024, p < 0.001, d = 0.20) with peaks 2009–2010 and 2015. These results demonstrated exposure dependent alterations in these standard blood tests.

January 2005- August 2024 (A) WBC levels were most significantly elevated in years of escalation pre-October 7th in men 19–45 (15 s vs 90 s, 2008, p < 0.01, 2014-p < 0.001; 2018; p < 0.01, d = 0.29, bottom, left), men 46–64 (2007, p < 0.001, 15 s vs 90 s, d = 0.32, bottom, center panel) and men 65+ (2005 p < 0.001, d = 0.56, bottom, right panel). B MCV levels were significantly elevated in 30 s women pre-October 7th (30 s vs 90 s,19–45, 2005–2024, p < 0.01, top, right panel; 46–64, 2005–2024 p < 0.01, top center panel) with peak in 2010. Men, 30 s vs 90 s and women (19–45, 46–64, 30 s vs 90 s, 2005–2024, p < 0.001) with peaks 2009–2010, 2015, and 2022.
Overall liver enzymes were especially sensitive to exposure, each in a distinct manner. Gamma-glutamyl transferase (GGT) levels (Fig. 4A) were elevated chronically and significantly in both men and women with small to moderate effect size in high exposure areas despite being in a normal healthy range. In men in years of escalation there was a significant elevation compared to 90 s men in the 46–64 age group (2007, 15 s vs 90 s, p < 0.001; 2009, 15 s vs 90 s p < 0.001; 2019, 15 s vs 90 s, p < 0.001, up to d = 0.42), while 15 s women 46–64 had a 2019 peak compared with 90 s (15 s vs 90 s, p < 0.0001, d = 0.40). 15 s men 19–45 exhibited significant elevations compared with 90 s men (2008–2009, 15 s vs 90 s, p < 0.001; 2011, 15 s vs 90 s, p < 0.001; 2013–2014, 15 s vs 90 s, p < 0.01; 2022, 15 s vs 90 s, p < 0.001, up to d = 0.27). After acute exposure (Fig. 4A lower, left inset), 15 s men 19–45 had highest post-Oct 7th levels (15 s post vs 90 s post, 15 s post avg, 60.521, SD 13.5, 90 s post avg, 35.9, SD 0.47, p < 0.0001).

A GGT were elevated chronically and signficantly specifically in high exposure men 46–64 (bottom, center) in years of escalation (2007, 15 s vs 90 s, p < 0.001; 2009, 15 s vs 90 s p < 0.001; 2019, 15 s vs 90 s, p < 0.001, d = 0.42), while women 46–64 showed peak levels in 2019 (15 s vs 90 s, p < 0.001, d = 0.40). Men 19–45 elevations with a d = 0.27 (2008–2009, 15 s vs 90 s, p < 0.001; 2011, 15 s vs 90 s, p < 0.001; 2013–2014, 15 s vs 90 s, p < 0.01; 2022, 15 s vs 90 s, p < 0.001). Men 19–45 had highest post-October 7th levels (lower, left, inset, 15 s post vs 90 s post, 15 s post avg, 60.521, SD 13.5, 90 s post avg, 35.9, SD 0.47, p < 0.0001). B ALT were also chronically elevated in 15 s in both men (46–64, peak 2019 p < 0.001, d = 0.28, bottom, center panel) and in women 19–45 had particulary high elevation in 2016, (15 s vs 90 s p < 0.001, d = 0.37), while women 46–64 had elevations from from 2013–2022 (15 s vs 90 s p < 0.01). Post-October 7th, males 19–45 in all shelter times had elevations (p < 0.01, 15 s pre vs 15 s post, d = 0.20; 30 s pre vs 30 s post, 90 s pre vs 90 s with small d = < 0.20) (C) Alkaline Phosphate (Alk Phos) levels, also increased significantly pre vs post October 7th in every age group (insets), gender and shelter time, even low exposure (men, 19–45, 46–64, 65+, p < 0.001,15 s pre vs 15 s post; p < 0.001 30 s pre vs 30 s post ; p < 0.001, d up to 0.35). D In AST had significant changes within each shelter time pre vs post October 7th in the same direction of elevation in all ages except 15 s males over age 65 + , with highest d = 0.2 in women ages 46–64 (p < 0.001, 30 pre vs 30 s post).
Alanine transaminase (ALT) (Fig. 4B) was also chronically elevated prior to October 7th in 15 s women and 15 s men (men, 46–64, peak 2019 p < 0.001, d = 0.28). After the acute exposure on October 7th, there were significant changes in males 19–45 within each shelter times (15 s pre vs 15 s post, 30 s pre vs 30 s post, 90 s pre vs 90 s with d = 0.20). 15 s women 19–45 had a peak elevation in 2016 and small to moderate effect size compared with 90 s women, (15 s vs 90 s p < 0.001, d = 0.37), while 15 s women aged 46–64 had elevations from 2013–2022 (15 s vs 90 s p < 0.01). 15 s men aged 46–64, had peak significant elevation in 2019 (p < 0.001 15 vs 90 s, d = 0.28). After October 7th, both men and women also had significant elevations from baseline in all shelter times, specifically 30 s women aged 46–64 pre-Oct 7th compared with 30 s women post Oct 7th (p < 0.001, 30 s pre vs 30 s post, d = 0.25). Men of all shelter times aged 19–45 were significantly elevated from baseline levels in all shelter times (p < 0.01, 15 s pre vs 15 s post, d = 0.20, p < 0.01, 30 s pre vs 30 s post, 90 s pre vs 90 s, d = 0.2).
Alkaline Phosphate (Alk Phos) levels (Fig. 4C) also highly increase significantly pre- vs post-October 7th in every age group, sex and shelter time, even in 90 s exposure, with small to moderate effect size, d = 0.35, in men (19–45, 46–64, 65 + , p < 0.001,15 s pre vs 15 s post, (p < 0.001 30 s pre vs 30 s post; p < 0.001 90 s pre vs post).
Aspartate transferase (AST) had significant elevations within each shelter time pre- vs post-October 7th in both sexes (men: p < 0.01, 19–45, 46–64, 15 s pre vs 15 s post, 30 s pre vs post, 90 s pre vs post, d < 0.20; women: 46–64, p < 0.001, 30 s pre vs 30 s post, d = 0.20). Liver enzymes compared pre vs post Oct 7th were significant in men in an exposure dependent gradient.
We next used generalized linear regression models to examine interactions between exposure, sex, and blood biomarkers in relation to diagnostic outcomes among adults aged 46–64 years, the group showing the greatest vulnerability to sex-specific disease patterns under differential exposure (Table 1).
For psychiatric load, high exposure (15 s) was associated with substantially higher odds compared with low exposure (90 s), a more than a six-fold increase (OR = 6.68, p < 0.000), while moderate exposure (30 s) was associated with 46% higher odds (OR = 1.46, p < 0.000). Overall, men had lower odds of psychiatric diagnoses than women (OR = 0.66, p < 0.05), an effect that was particularly evident in the 30 s exposure zone (OR = 0.78, p < 0.05). Higher WBC counts were associated with increased odds of psychiatric diagnoses overall (OR = 1.10, p < 0.000), and interaction analyses indicated that men in the 15 s zone with elevated WBC had 84% higher odds of psychiatric load compared with the reference group (OR = 1.84, p < 0.05).
For organ-specific autoimmune disease, moderate exposure (30 s) was associated with 20% higher odds relative to low exposure (90 s) (OR = 1.20, p < 0.05). Higher MCV was associated with a modest but statistically significant increase in odds (OR = 1.07, p < 0.05), whereas lower MCV in the 30 s zone was associated with reduced odds (OR = 0.82, p < 0.05). Elevated WBC in the 30 s zone was also associated with higher odds of autoimmune disease (OR = 1.17, p < 0.05). Higher GGT levels showed a trend toward reducing odds in the 15 s zone (OR = 0.63, p = 0.09).
The strongest associations were observed for alkaline phosphatase (ALP) in which elevated ALP in the 15 s zone was associated with more than two-fold higher odds of autoimmune disease overall (OR = 2.19, p = 0.02). Sex-specific interaction terms indicated increased odds among women with elevated ALP in the 15 s zone, whereas men with elevated ALP in the same exposure zone exhibited substantially lower odds of autoimmune disease relative to women (OR = 0.31, p = 0.02).
Due to vulnerability to both high and moderate CTS from 2005–2023 and considering both psychiatric and physical manifestations of CTS, we examined survival rates in the affected age groups, 46–64, in both women and men. The results were highly significant showing that men ages 46–64 (Fig. 5B) living in 15 s areas, had a significantly 88% increased risk of death (HR = 1.88, p < 0.001; CI, 1.20–2.60), compared with moderately (30 s, 45 s, 60 s) exposed men had only a 12% increased risk (HR = 1.12, p < 0.001; CI, 1.05–1.24). Women in moderately exposed regions (30 s, 45 s, 60 s) had an increase of 14% (HR = 1.12, p < 0.01; CI, 1.00–1.27) and no increased risk due to 15 s exposure (Fig. 5A). Comparing men to women, 15 s men had a 374% increased risk of mortality (HR = 3.74, p < 0.001; CI: 1.54–9.1), while moderate exposed men had a 178% increased risk in mortality (HR = 1.78 p < 0.000; CI :1.43–2.2) and low exposed men had a 185% increased risk in mortality (HR = 1.85,p < 0.000; CI:1.72–1.99). These results highlight that high exposure in men was a robust sex-specific risk factor for mortality when compared to women or men of other shelter times.

Survival Curve 2005–2023 in the vulnerable 46–64 age group (A) Females in moderately exposed (30 s, 45 s 60 s) regions had a slight increase of mortality compared to low exposed (90 s), 14% (p < 0.01) and no increased risk due to high exposure. B Men living in high exposed areas had a significantly 88% increased risk of mortality (HR = 1.88, p < 0.001; CI, 1.20–2.60, 15 s vs 90 s), while moderately exposed males (30 s, 45 s, 60 s) had only a 12% increased risk (HR = 1.12, p < 0.01; CI, 1.00–1.27). Comparing men to women, 15 s men had a 374% increased risk of mortality (HR = 3.74, p < 0.001; CI: 1.54–9.1), while moderate exposed men had a 178% increased risk in mortality (HR = 1.78 p < 0.000; CI :1.43–2.2) and low exposed men had a 185% increased risk in mortality (HR = 1.85, p < 0.000; CI:1.72–1.99).
Source link