This chart collection examines trends in market competition among commercial health insurers in the large group, small group, and individual markets using enrollment data for fully insured and individual plans using 2013-2023 data from Mark Farah Associates. This analysis also incorporates 2013-2023 enrollment data for self-funded plans from Mark Farrah Associates for certain charts. This analysis uses three metrics of market competition: the market share of the largest insurer in each state; the number of insurers in each state with at least 5% market share; and the Herfindahl-Hirschman Index (HHI), a standard measure of market concentration across all industries.
The impact of consolidation on prices and enrollee experience depends on a variety of factors, including regulation and the market power of other healthcare stakeholders. In the context of health insurance markets, high concentration may give insurers more leverage to negotiate lower payments to providers. Conversely, a lack of competition could give insurers less incentive to lower costs for enrollees and afford purchasers less choice when seeking coverage.
While commercial health insurer participation can vary significantly within states, this analysis focuses on state-level data and national averages of market concentration data across states. This data is illustrative of trends in health insurance market competitiveness, though it may not reflect the actual geographic markets where health insurance is offered. For example, group market plans may be purchased for employees living across the country while individual market plans are typically offered at the county or local level (though in many cases insurance carriers do operate statewide).
On average, commercial health insurance markets remained highly concentrated across market segments between 2013 and 2023. However, particularly since 2020, the individual market has grown more competitive while fully insured group markets have become less competitive. More than 9 in 10 people who purchase individual market coverage do so through the Affordable Care Act (ACA) Marketplaces, and much of the coverage purchased off-Marketplace is also ACA compliant coverage and therefore mirrors plans sold on the Marketplace.
A few health insurers account for a majority of enrollment in fully insured and self-funded private coverage, Medicaid Managed Care and Fee-for-Service type Medicaid programs, and Medicare Advantage. As of 2025, the three largest insurance parent companies in the United States are UnitedHealth, Elevance Health (formerly known as Anthem), and CVS Health (which acquired Aetna in 2018). Different insurers specialize in providing coverage in different markets. For example, a majority of Centene’s medical membership is enrolled in Medicaid, while a majority of UnitedHealth’s medical membership is enrolled in commercial insurance.
Related Content:
The chart above presents enrollment data for the ten largest insurers across the individual market, fully insured and self-funded group plans, Medicaid Managed Care and Fee-for-Service type Medicaid programs, and Medicare Advantage plans. Across all insurers, plans in these markets represent about 320 million enrollments, which may include some double-counted enrollees with multiple sources of coverage. This chart includes enrollment in administrative services only (ASO) arrangements, under which a third-party administrator, often an insurer, handles claims processing and related functions while the employer assumes financial responsibility for the claims. The remainder of this analysis focuses on competition in commercial insurance markets, though there are also high levels of insurer concentration in some other health insurance markets, such as Medicare Advantage.
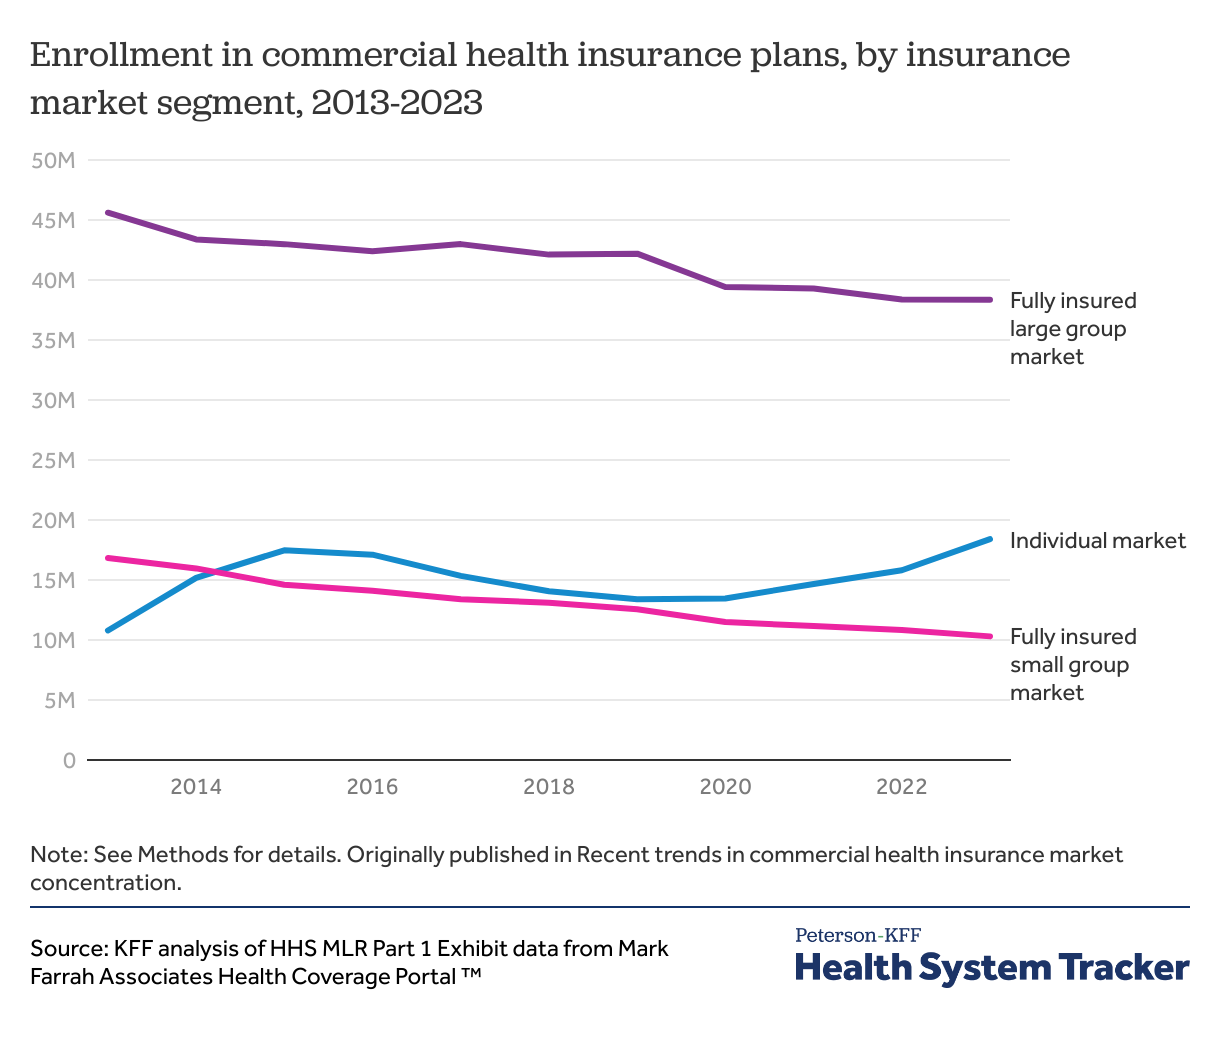
In most states, the large group market is for firms with more than 50 employees to purchase fully insured coverage, and the small group market is for firms with 50 or fewer employees to purchase fully insured coverage. Individuals can purchase coverage for themselves and their families in the individual market, including plans sold on the healthcare marketplaces established under the Affordable Care Act (ACA) as well as ACA-compliant and non-compliant coverage (such as short-term plans) sold off-exchange. For the large and small group markets, this analysis focuses on fully insured plans— an insurance arrangement in which the employer contracts with a health plan that assumes financial responsibility for the costs of enrollees’ medical claims. The presence of self-funded options for employers (not captured in this chart) is an additional consideration when evaluating how much choice employers have.
Enrollment in fully insured plans in the large group market declined from about 46 million in 2013 to about 38 million in 2023 and enrollment in fully insured plans in the small group market declined from about 17 million in 2013 to about 10 million in 2023. Meanwhile, individual market enrollment increased from about 11 million in 2013 to about 18 million in 2023.
Despite the decline in enrollment in fully insured group plans, the number of enrollees in employer-sponsored insurance (ESI) overall has remained steady. The declining trends in the fully insured large group and small group markets in the chart above reflect a shift among employers towards self-funded plans (discussed below).
By contrast, individual market enrollment rose after the implementation of the ACA in 2014, which established health insurance Marketplaces for individuals to purchase coverage and instituted new consumer protections. It grew again when enhanced premium tax credits, introduced in 2021, expanded eligibility for ACA Marketplace subsidies and increased financial help for people already receiving a tax credit. As a result, the individual market has experienced large increases in enrollment in recent years, accompanied by a decline in the uninsured population. The enhanced tax credits, which were temporarily extended in 2022, will expire at the end of 2025 unless Congress extends them. If the enhanced subsidies expire, ACA Marketplace premium payments are expected to increase sharply and about 4 million people are projected to lose coverage.
Self-funded plans— an insurance arrangement in which the employer assumes direct financial responsibility for the costs of enrollees’ medical claims, often in contract with a third-party administrator or insurer to provide administrative services —are regulated federally and are exempt from most state-level regulations.
In some cases, self-funded plans may be combined with stoploss insurance to limit financial risk for firms. Self-funding includes level-funding— an insurance arrangement in which the employer makes a pre-arranged payment each month, subject to annual adjudication, to an insurer or third party administrator which pays for claims, administrative costs, and premiums for stop-loss coverage.
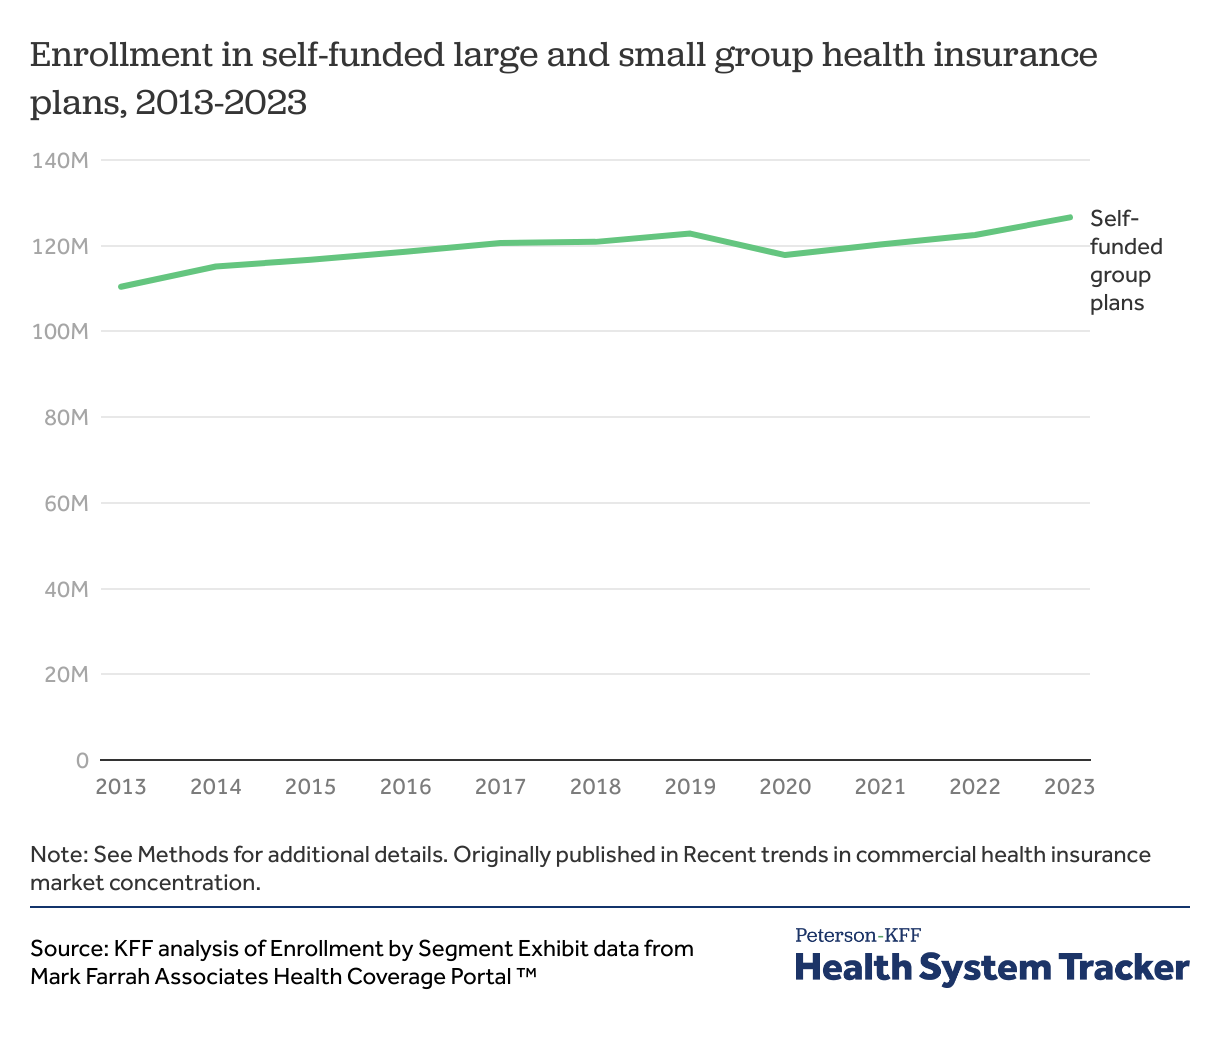
Between 2013 and 2023, enrollment in self-funded group plans increased from about 110.4 million to about 126.6 million. In 2025, the KFF Employer Health Benefits Survey found that 67% of covered workers are enrolled in a self-funded plan.
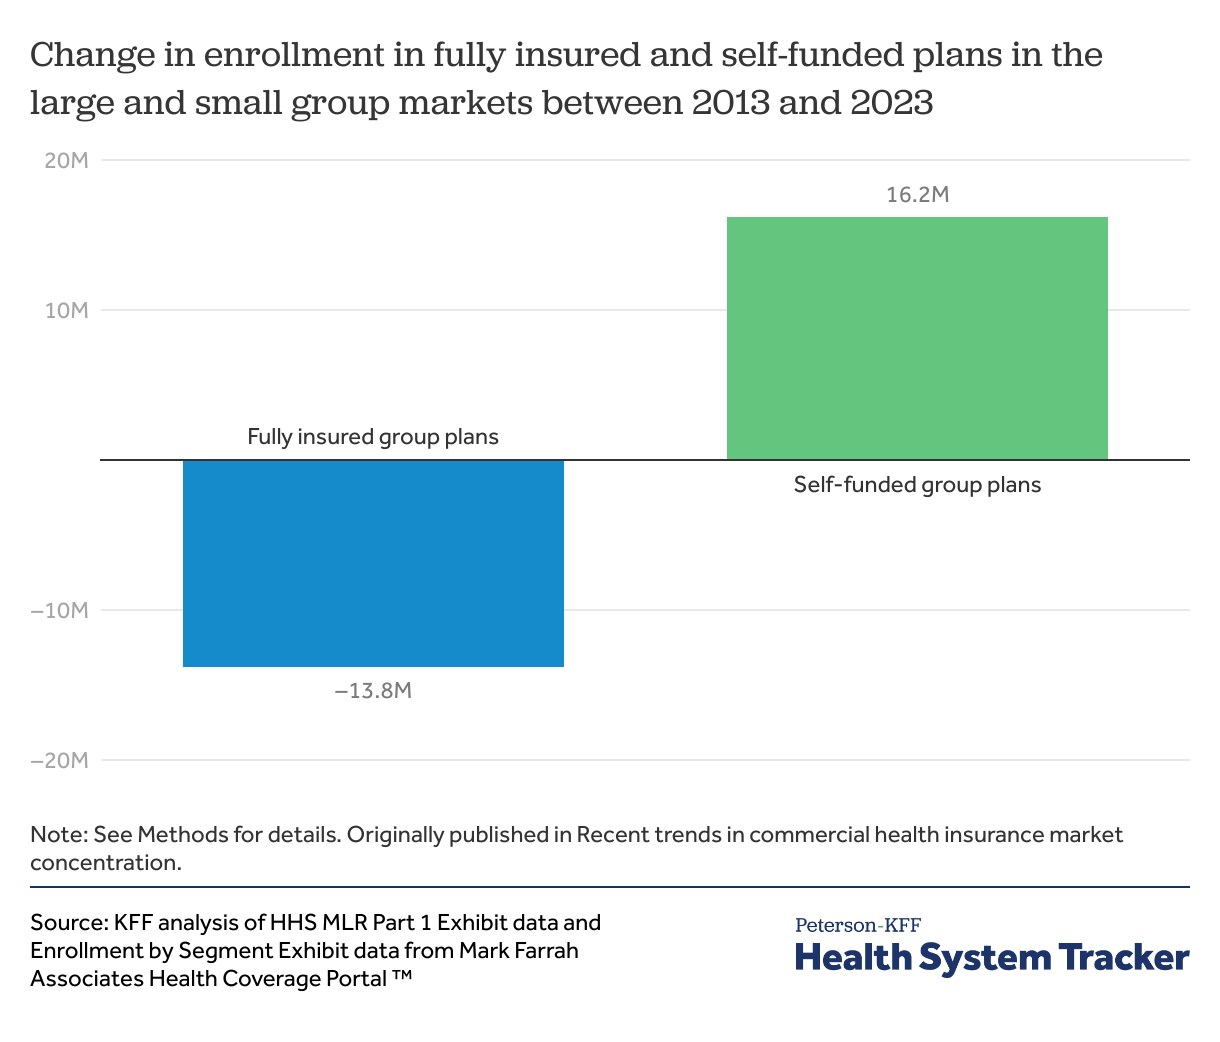
Between 2013 and 2023, enrollment in fully insured group plans declined by about 14 million while enrollment in self-funded group plans increased by about 16 million. While employees in large firms are typically enrolled in self-funded plans, small employers are increasingly shifting towards level-funded plans due to rising premiums in the fully insured small group market. In 2025, 44% of covered workers in small firms with 10-49 employees were enrolled in a self-funded or level-funded plan.
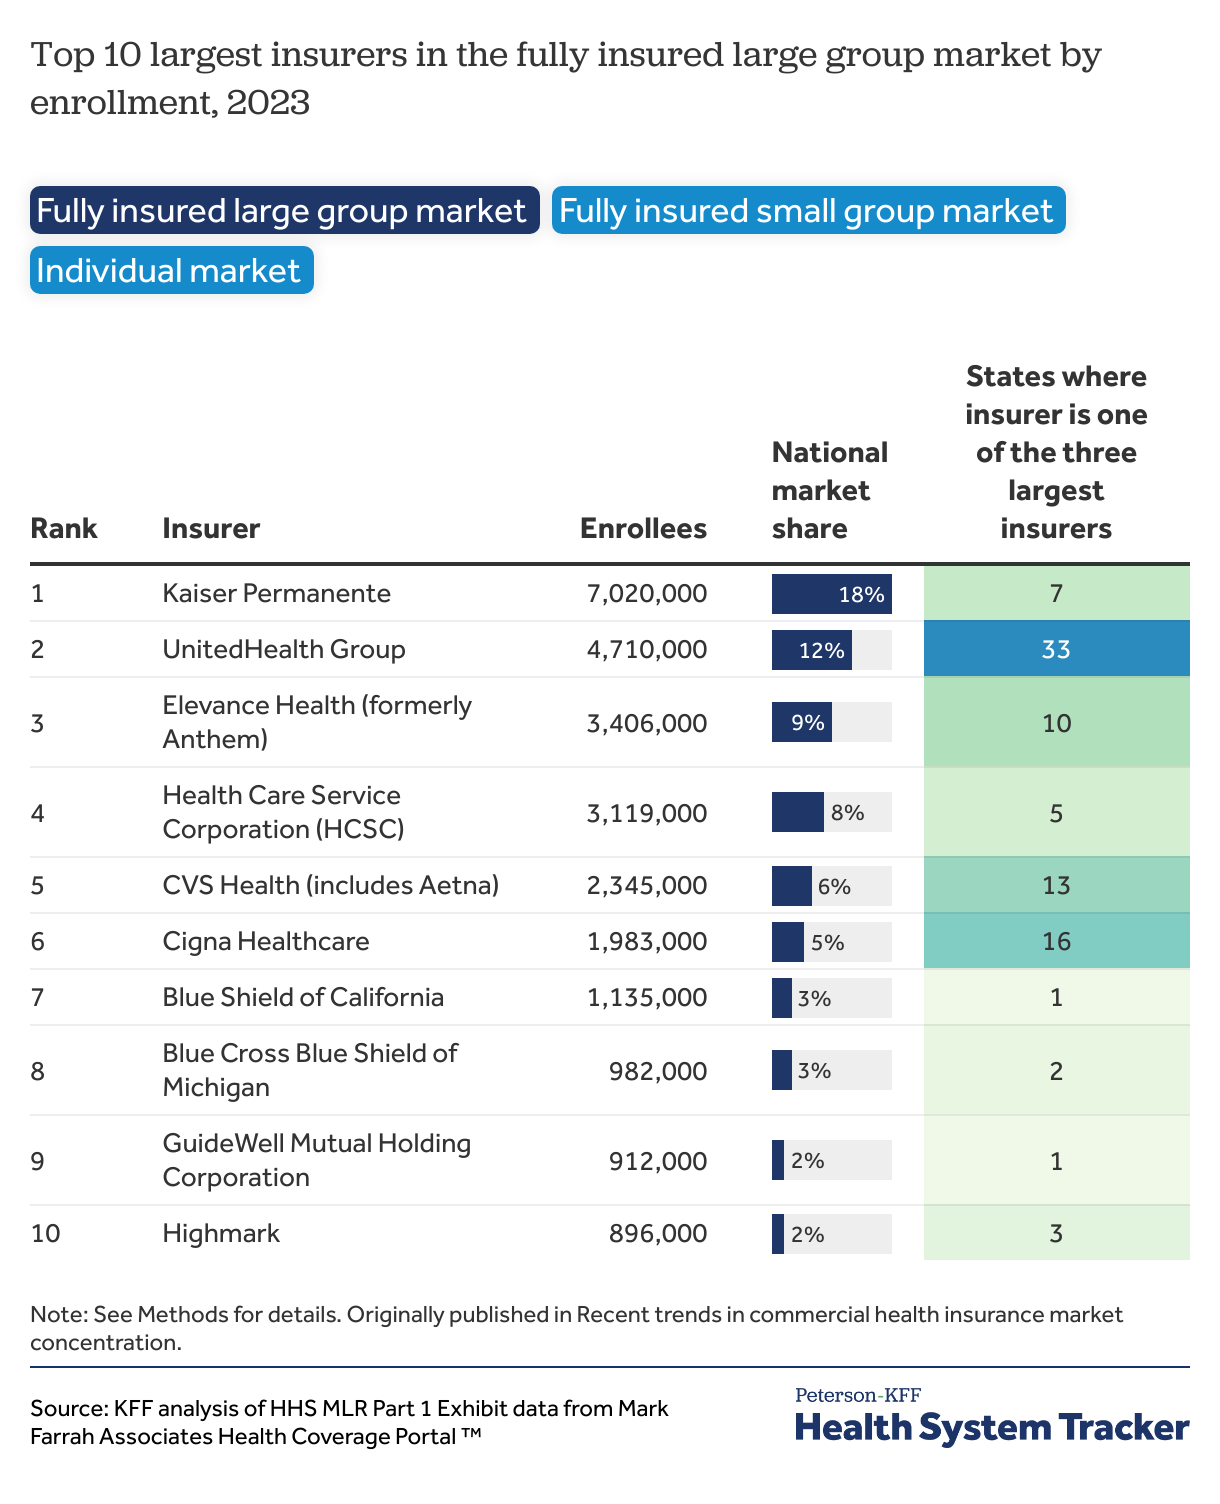
Within the fully insured commercial market, a few large insurers maintain a significant presence across many states. Even then, insurers are unlikely to have an equally large presence across all market segments.
For example, while Centene is the largest insurer in the individual market (18% national market share) and is one of the three largest individual market insurers in 23 states, it is not one of the ten largest insurers in the fully insured group market.
Conversely, UnitedHealth Group has a much lower market share in the individual market (4%) than it does in either the fully insured small group (16%) or fully insured large group (12%) markets. As such, UnitedHealth is one of the three largest insurers for 39 states in the fully insured small group market, 33 states in the fully insured large group market, and only 11 states in the individual market.
The dynamics shaping the fully insured group and individual markets are not always directly comparable. For example, large firms may want insurers with broad networks to cover employees spread across the country while small firms may want more tailored insurance products.
Aside from the few insurers with a large presence across the country, most insurers specialize in just one or a handful of states, leaving many local insurance markets with a few dominant insurers. For example, Guidewell, the second-largest insurer in the individual market, only operates in Florida. While Guidewell has 8% market share nationally in the individual market, it represents a plurality of Florida’s individual market enrollment (43%). Similarly, Kaiser Permanente, the largest insurer in the fully insured large group market, has 18% market share nationally, but is one of the three largest insurers in 7 states, including California. Most Kaiser Permanente enrollees live in California, leaving it with 54% market share in the California fully insured large group market. This analysis calculates insurer market share at the state-level using enrollment data, though health insurance is not necessarily offered at the state-level.
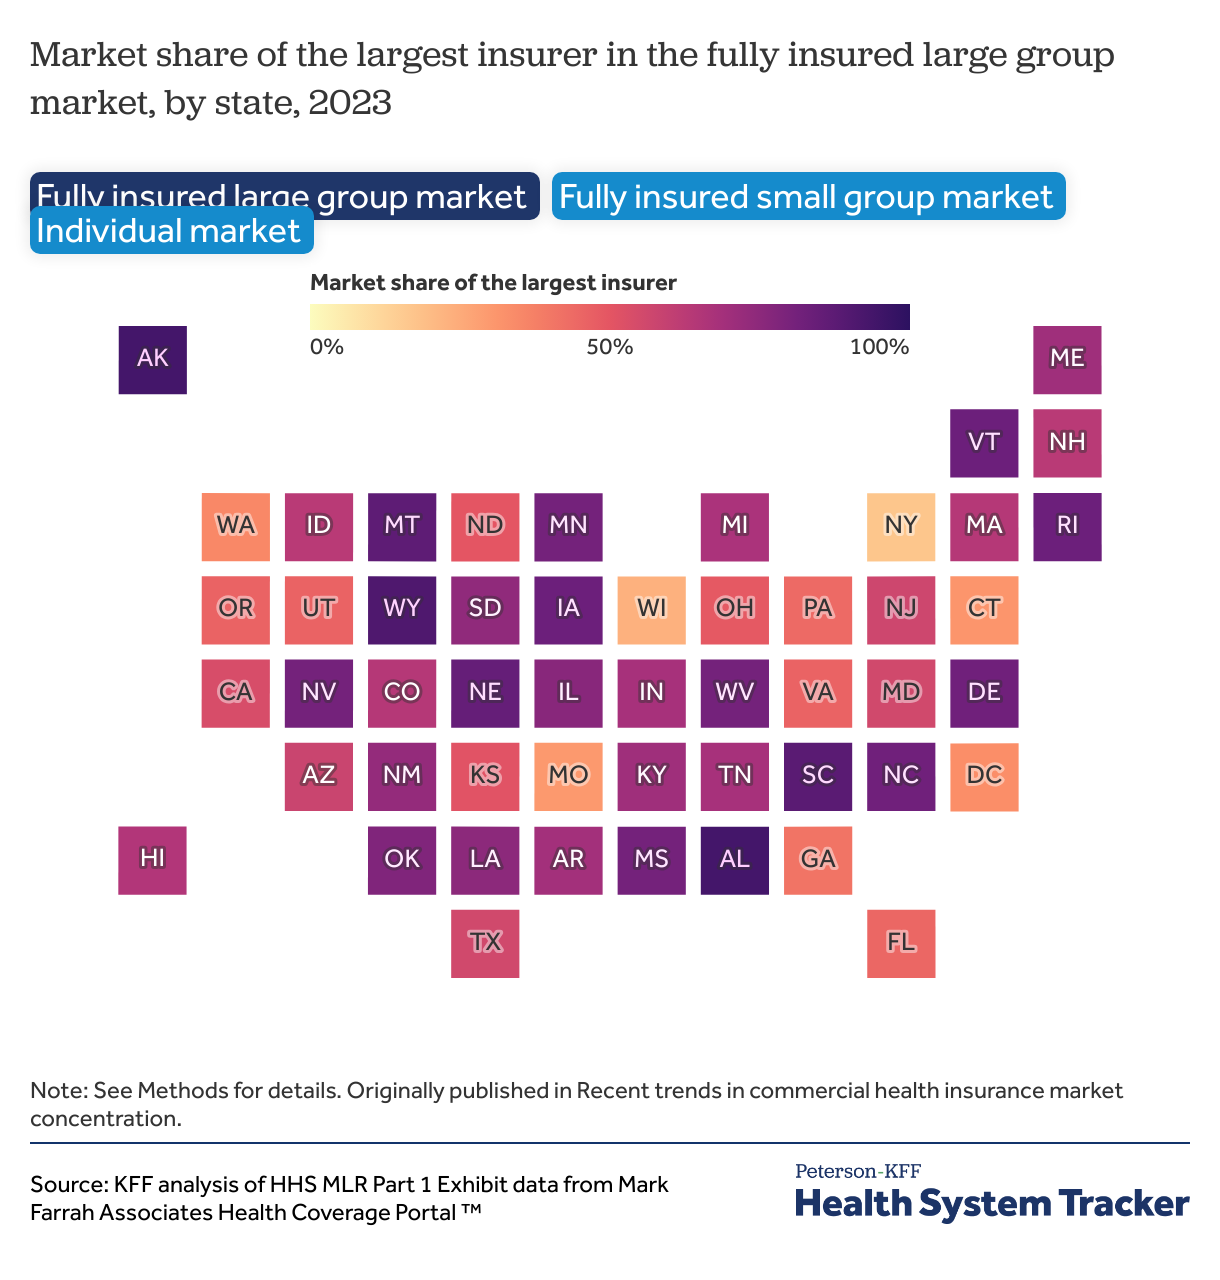
Several states have a single dominant insurer. On the high end, in the fully insured large group market, Blue Cross Blue Shield of Alabama has 94% market share in Alabama. Even larger states can have a dominant insurer in a particular market segment; Blue Cross Blue Shield of North Carolina has 82% market share in North Carolina’s fully insured large group market.
Six states—Alabama, Alaska, Delaware, Louisiana, Mississippi, and West Virginia—have a fully insured small group insurer with more than 90% market share, and 11 more states have a fully insured small group insurer with market share between 80-90%.
Within the individual market, at the extreme, Highmark has 93% market share in Delaware, while Wellmark has 90% market share in Iowa.
Across all market segments, a few states, like Georgia, New York, Washington, and Wisconsin, have no insurer with over 50% market share and several insurers with similar market shares.
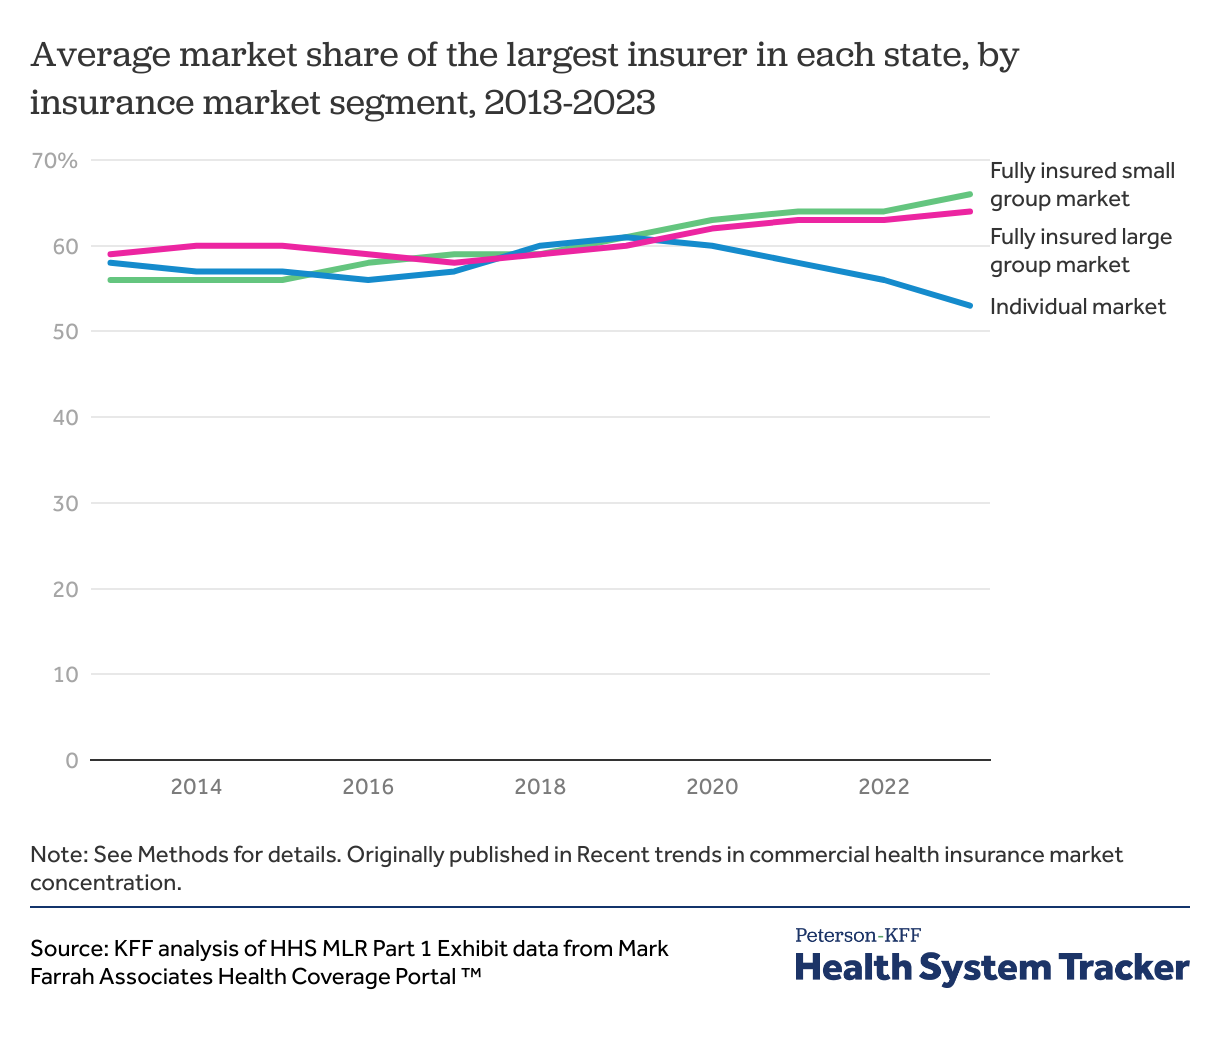
Back in 2013, the average market share of the largest insurer in each state was similar across the fully insured large group (59%), fully insured small group (56%), and individual (58%) market segments. This trend remained relatively stable through 2019 but then diverged in 2020. Since then, the average market share of the largest insurer in each state has grown in both the fully insured large group (64%) and fully insured small group (66%) markets, while it has declined in the individual market (53%).
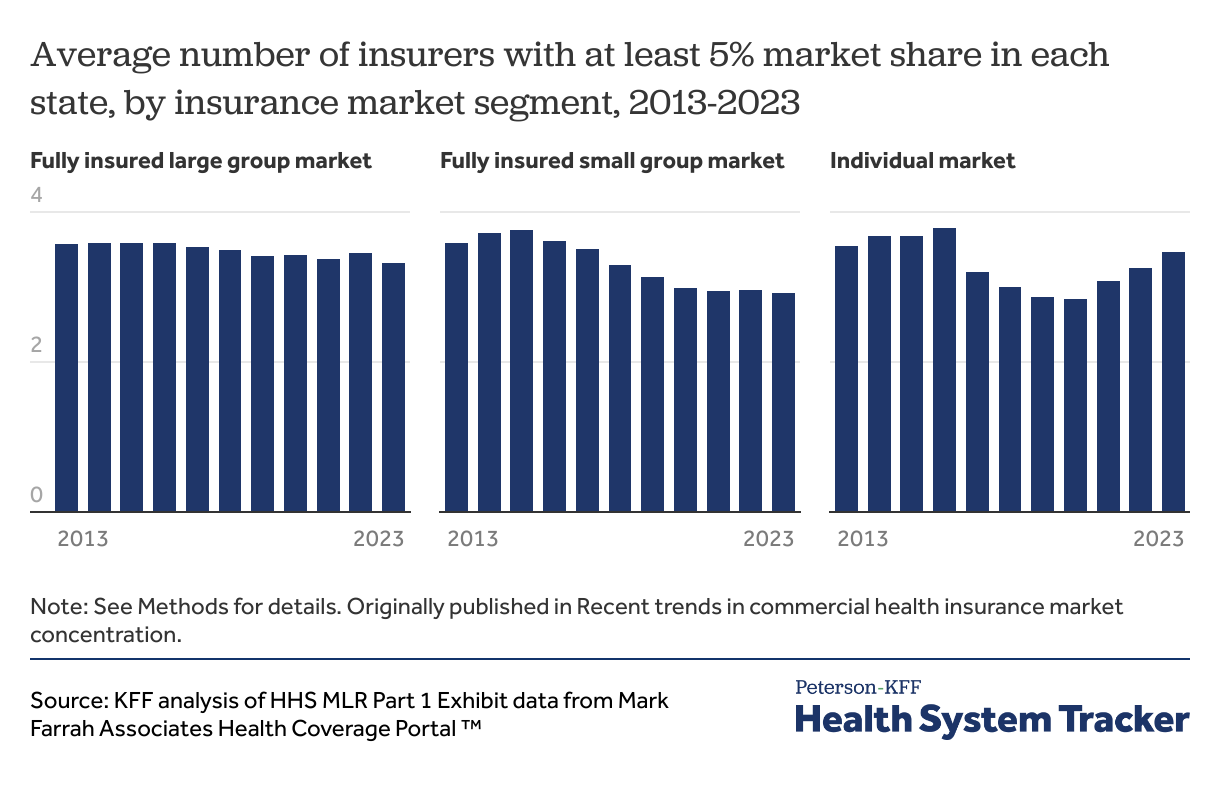
There are many health insurance companies operating in each state, but some plans have very low enrollment and do not meaningfully compete with the larger insurers. This chart shows the average number of insurers in each state with 5% or more of enrollment in each market segment. There are many more insurers with less than 5% market share, and even more who may hold licenses to operate in the state but are not offering products at this time.
The average number of insurers in each state with at least a 5% market share has fallen in the large group market (from 3.6 in 2013 to 3.3 in 2023) and small group market (3.6 to 2.9). The individual market has seen periods of increases and decreases, but the average number of insurers with a market share of 5% or more across states in 2023 was similar to 2013 (3.5).
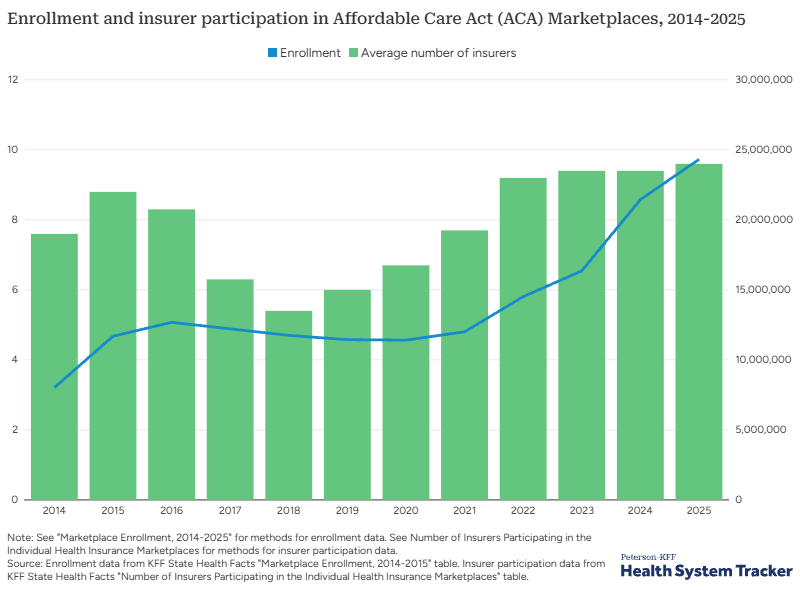
Many factors can affect insurer participation in a market, including mergers and acquisitions and regulatory barriers. The number of expected enrollees in a market is also a key deciding factor. For example, in the individual market, the number of participating insurers has increased as enrollment has increased.
The chart above shows the average number of insurers in each state’s ACA Marketplace mapped against the national number of enrollees. While many insurers entered the ACA Marketplaces when they first opened in 2014, enrollment numbers were ultimately lower than projected and per enrollee costs were higher than expected. After a period of market instability and insurer exits, insurers began to reenter the market in 2018 and 2019. When enhanced premium tax credits were made available in 2021, which drew more enrollees, insurers entered new states and expanded their footprints within states. Both insurer participation and enrollment in the ACA Marketplaces are currently at record highs.
This pattern can also be seen at the local level, with urban areas often having more participating insurers than more sparsely populated rural areas.
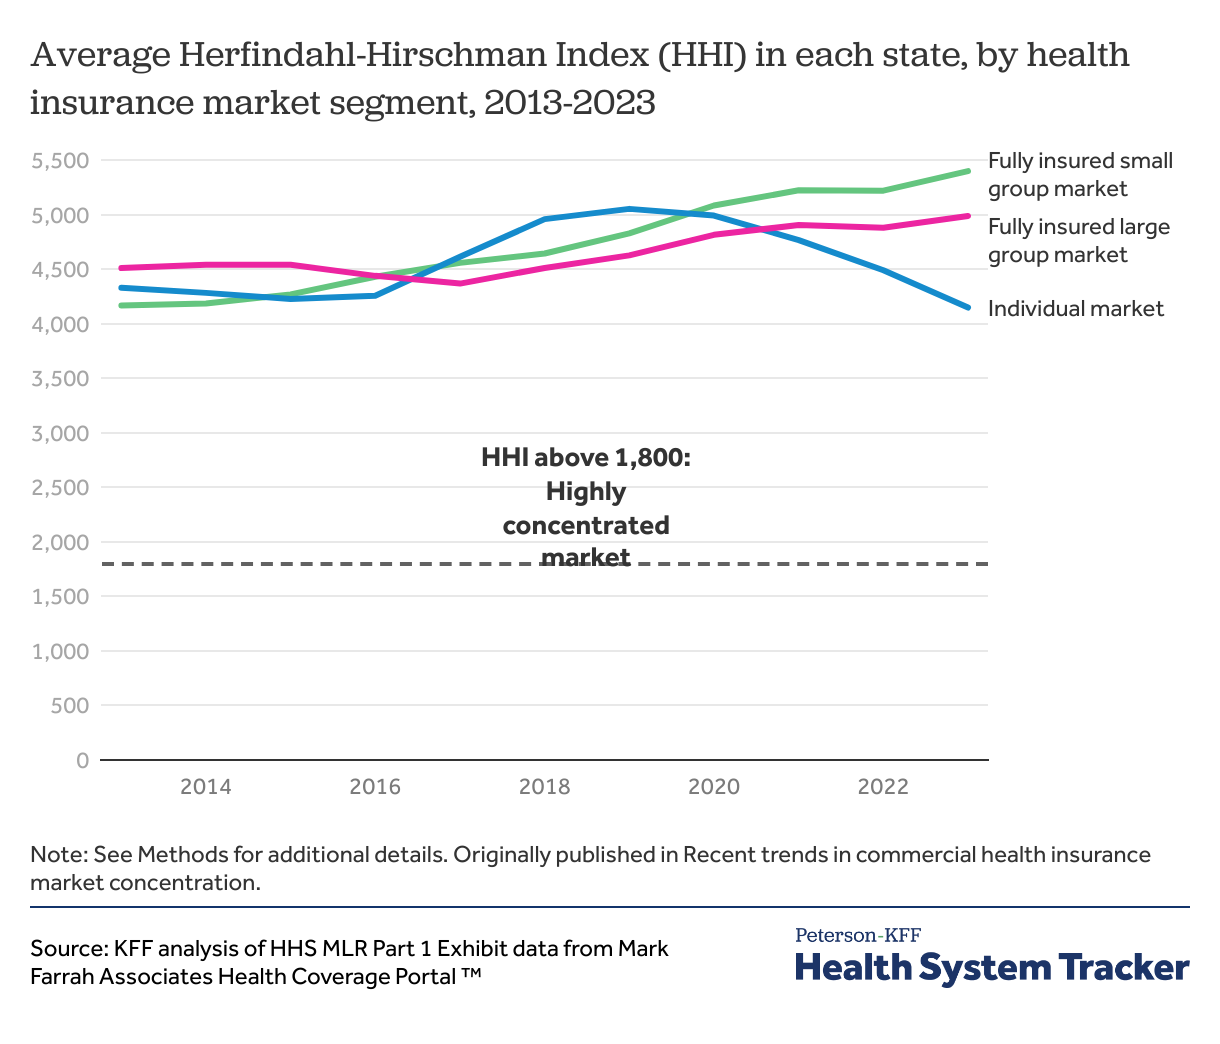
Another metric of market competitiveness is the Herfindahl-Hirschman Index (HHI), calculated as the sum of the squares of the market shares of each firm in any given market. The HHI ranges from 0 to 10,000, with a lower HHI indicating a more competitive market and a higher HHI indicating a less competitive market. The Department of Justice (DOJ) and the Federal Trade Commission (FTC) use the HHI to identify anticompetitive mergers across all industries. The 2023 merger guidelines issued by both agencies categorize markets with HHIs between 1,000 and 1,800 as “moderately concentrated” and markets with HHIs above 1,800 as “highly concentrated.” This analysis calculates HHI at the state-level using state-level enrollment data and market shares, though this may not be how regulators define health insurance markets.
On average across states, all health insurance market segments are highly concentrated under this definition. Trends in HHI across market segments mirror trends in the market shares of the largest insurers. In 2013, all market segments were similarly concentrated, with the fully insured small group market (4,166) being the most competitive, followed by the individual (4,328) and fully insured large group (4,509) markets. As noted, the purchasing dynamics in each of the three markets differ considerably and are influenced by the availability of non-insured products such as self-funded or level-funded plans, Multiple Employer Welfare Arrangements (MEWAs), and other association health plans. Further, these dynamics do not capture the number of choices available to purchasers, as buyers may be unable to select among all the provider networks offered by insurers.
Since 2020, though, the individual market has grown less consolidated, while concentration has steadily increased in the fully insured group markets.
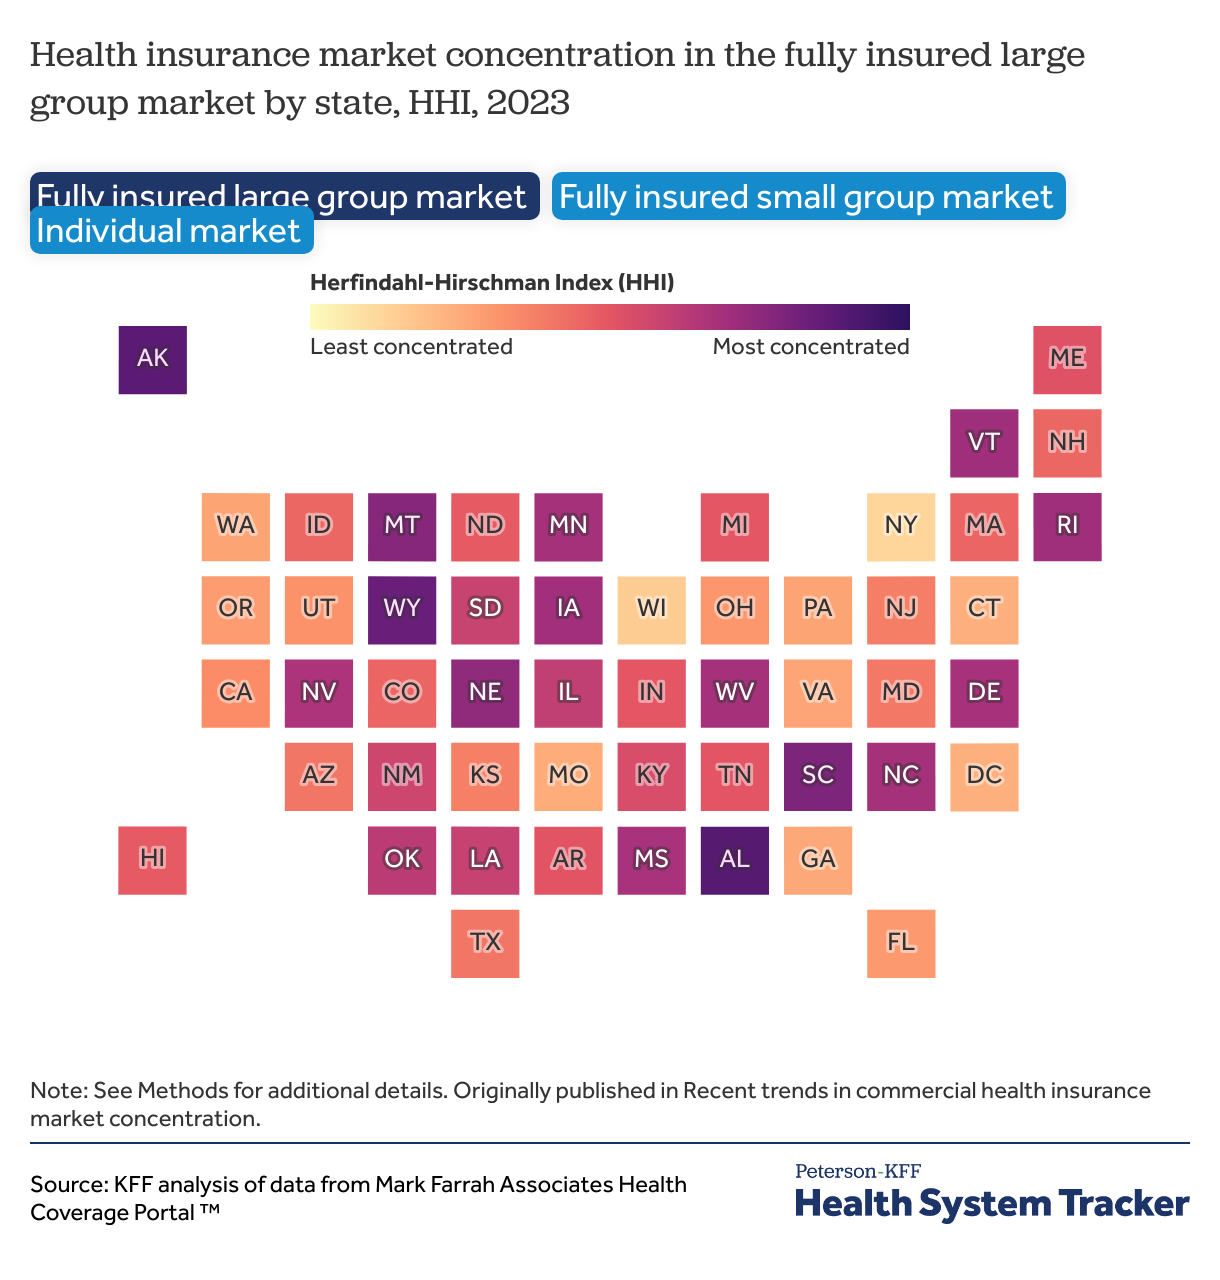
While the national average of HHI for health insurance markets across states does not fully reflect local variation, there are high levels of insurer concentration throughout the country. Using the 2023 merger guidelines, which define markets with an HHI over 1,800 as highly concentrated, most fully insured large group (48 states and DC), fully insured small group (all 50 states and DC), and individual (47 states and DC) markets were highly concentrated in 2023. Many factors can affect insurer concentration at the local level, including state regulations, the ease of establishing provider networks, the number of available enrollees in a market, and the concentration of other healthcare stakeholders, such as providers.
Though this analysis calculates HHI at the state-level, this does not reflect the actual geographic markets in which health insurance is often sold. Still, this data is reflective of trends in insurer concentration observed at other geographic levels. A 2023 report from the American Medical Association found that most private insurance markets are also highly concentrated at the metropolitan statistical area (MSA) level.
Data from this chart collection comes from Mark Farrah Associates (MFA). All enrollment data shown are labelled as “Medical focus” in MFA and are rounded to the nearest thousand. Plans that were labelled as “property” were removed. Individual insurers are aggregated to the parent company level.
Enrollment data for the ten largest insurers across all insured in 2025 come from the Enrollment by Segment Exhibit compiled by MFA. Enrollment by insurer includes enrollment data across the individual market, fully insured and self-funded group plans, Medicaid Managed Care and Fee-for-Service type Medicaid programs, and Medicare Advantage. Enrollment in these categories sum to about 320 million enrollments. Enrollees who have multiple types of insurance such as through multiple managed care organizations (MCOs) will be counted twice.
Self-funded group data are also sourced from Enrollment by Segment Exhibit data. Since enrollment for many self-insured plans are not required to be reported to the NAIC or state regulators or may be reported under the “uninsured plans” category, Mark Farrah Associates estimates administrative services only (ASO) enrollment using the Supplemental Health Care Exhibit submitted to the NAIC as well as other sources like company reports and Securities and Exchange Commission 10k and 10Q reports. These tables reflect enrollment in ASO plans in which insurers and third-party administrators (TPAs) oversee benefit administration for self-insured employers but do not pay claims. Self-funded enrollment data includes self-funded plans in both the large group and small group markets.
All other enrollment data for commercial health plans between 2013 and 2023 in the fully insured large group, fully insured small group, and individual markets are sourced from HHS MLR Part 1 Exhibit data compiled by MFA. Group enrollment data includes mini-med. Enrollment by state is measured in life-years which is calculated using reported member month data (member months divided by 12). National averages using MLR Part 1 data are simple averages of enrollment data aggregated at the state- level. Health insurance is not necessarily offered at the state-level, so the market share of the largest insurer, the number of insurers with at least 5% market share, and the HHI in actual health insurance markets may vary.
Further enrollment and insurer participation data for the ACA Marketplaces are compiled on KFF State Health Facts.
The Peterson Center on Healthcare and KFF are partnering to monitor how well the U.S. healthcare system is performing in terms of quality and cost.


Source link