Study population
This study used the WELL-China cohort as the discovery cohort. WELL-China is a population-based prospective cohort that recruited 10,268 participants aged 18–80 years from three districts in Hangzhou, Zhejiang Province, China, between the years 2016 and 201945. After excluding participants with incomplete or illogical FFQ, implausible energy intake (<800 or >4,000 kcal day−1 for males, <500 or >3,500 kcal day−1 for females) and self-reported cancer and CVDs46, 8,931 eligible participants were included in the analysis. Of these, 8,844 and 6,260 participants were included in the metabolomics and gut microbiota analyses, respectively. A flowchart detailing participant selection is presented in Extended Data Fig. 7. Ethical approval was obtained from the Institutional Review Boards of Zhejiang University and Stanford University. All participants provided written informed consent.
Dietary assessment
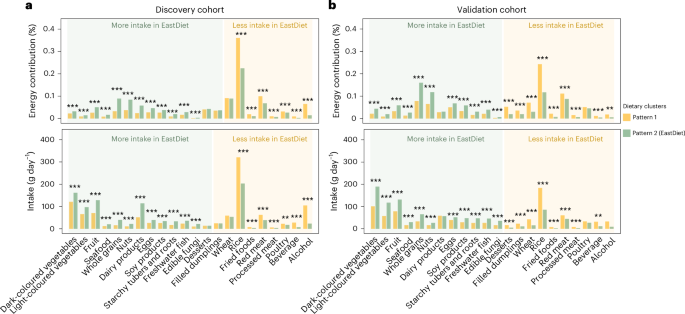
The reproducibility of FFQ instruments has been confirmed among Chinese populations47,48. Dietary intake was evaluated using a validated semiquantitative FFQ comprising 26 commonly consumed food items in China47,49,50. Participants reported the frequency and average amount of each food or beverage/alcohol consumed over the past 12 months. This 26-FFQ was validated against the 146-FFQ and the 3-day dietary records in the same population by the developer47. For the clustering analysis, several food groups were combined, including: (1) a combined rice category (steamed rice and rice porridge) and (2) a total alcohol category (beer, white liquor (baijiu), yellow rice wine (huangjiu) and wine), resulting in 22 food categories.
Measurement of adiposity-related phenotypes
All measurements were conducted by trained staff following standardized protocols. Weight, height, waist and hip circumference measurements have been previously described51. BMI was calculated as weight (kg) divided by height squared (m2). Waist-to-hip ratio was calculated as WC divided by hip circumference. Waist-to-height ratio was calculated as WC divided by height. Dual energy X-ray absorptiometry (DXA) measured fat distribution, including total body fat and body regional fat. Trunk fat percentage, android fat percentage, gynoid fat percentage and leg fat percentage were calculated as a percentage of total body fat mass. The android-to-gynoid fat ratio was calculated as android fat mass divided by gynoid fat mass. Obesity was defined as a BMI ≥28 kg m−2, and central obesity was defined as a WC ≥90 cm in men and ≥85 cm in women52.
Definition of incident MACE
MACE was identified through electronic linkage to disease and mortality registries, as well as local medical registration systems, using the International Classification of Diseases, Tenth Revision (ICD-10) codes. MACE included any stroke, nonfatal myocardial infarction, coronary revascularization and all-cause mortality, ascertained via corresponding ICD-10 codes and official death records53,54. Participants were followed from baseline until the first occurrence of a MACE event or the end of the study period (1 July 2024), whichever occurred first.
Measurement of covariates
Baseline covariates were collected through structured face-to-face interviews. Participants’ residential areas were categorized into three administrative districts of Hangzhou (Shangcheng, Xihu and Gongshu Districts). The smoking status was categorized as non-smoker, former smoker and current smoker. The educational status was divided into three levels: elementary (illiterate and primary school), secondary (junior high, high school and professional college) and higher (university and beyond). Physical activity was assessed by the International Physical Activity Questionnaire Short Form and categorized as low, moderate or high55. Nutritional supplement use was dichotomized into users and non-users. A family history of CVD was defined as self-reported records of stroke or myocardial infarction in either parents or children. A history of hypertension was defined as systolic blood pressure ≥140 mm Hg, diastolic blood pressure ≥90 mm Hg or self-reported physician diagnosis. A history of diabetes was defined as fasting plasma glucose ≥7.0 mmol l−1 or self-reported physician diagnosis. Antibiotic use was defined as described according to previous study56.
Metabolomics profiling
Plasma samples (100 μl) were mixed with 400 μl ice-cold methanol, vortexed and incubated at −20 °C for 30 min for protein precipitation. After centrifugation at 20,000 rcf for 15 min at 4 °C, the supernatant was collected. A 400-μl aliquot of the supernatant was transferred to a new tube and re-centrifuged under the same conditions. The final supernatant was used for ultra-performance liquid chromatography (UPLC)–high-resolution mass spectrometry (MS) analysis. Quality control (QC) samples, prepared by pooling equal aliquots (10–20 μl) from each sample, were injected periodically throughout the runs to monitor system stability. All steps were performed on ice.
The metabolomic profiling was conducted using a Vanquish Flex UPLC system coupled with an Orbitrap Exploris 120 mass spectrometer. The separation utilized an ACQUITY UPLC T3 column (100 mm × 2.1 mm, 1.8 μm) at 40 °C and 0.35 ml min−1. The mobile phases were (1) water containing 5 mmol l−1 ammonium acetate and 5 mmol l−1 acetic acid and (2) acetonitrile, used for gradient elution. Data were acquired in both positive (+3,800 V) and negative (−3,400 V) ion modes at 350 °C. Full MS scans (m/z 70–1050) were acquired at 60,000 resolutions (m/z 200), followed by MS–MS of the top four ions (>5,000 intensity) at 15,000 resolutions with a dynamic exclusion of 6 s. QC samples were analysed every ten injections to monitor and correct for system drift.
The raw MS data were converted to mzML files using MSConvert and processed using the XCMS package in R57. Peak detection was performed using the centWave algorithm, optimized for high-resolution data. The retention time alignment was conducted using the obiwarp method, followed by peak grouping and peak filling to generate a feature matrix. Each feature was defined by its m/z and retention time, and the matrix contained integrated peak areas for each feature across all samples. Subsequent preprocessing steps included: (1) filtering features with missing values in >30% of samples, (2) k-nearest neighbour imputation for remaining missing values, (3) replacing zero values with the minimum non-zero value for each feature, (4) correcting within-run batch effects using QC-based robust locally estimated scatterplot smoothing signal correction and (5) aligning feature intensities across batches using QC-based scaling. Finally, metabolites with a coefficient of variation >50% in QC samples and missing rate >30%, and drug and drug metabolites were excluded, retaining 794 metabolites for analysis. Metabolite intensities were rank-based inverse normal-transformed before the downstream analyses.
Gut microbiota profiling
Faecal samples were collected and stored at −80 °C. The V3–V4 region of the 16S rRNA gene was sequenced using the Illumina HiSeq PE-250 platform (Illumina). Detailed information on DNA extraction and paired-end 16S rRNA gene sequencing was described previously58. Taxonomic profiles were created using QIIME259. Paired-end reads were assembled using the qiime tools import command. The DADA2 pipeline was used to filter low-quality regions of the sequences, marker gene Illumina sequences and chimeric sequences. Reads were then summarized to amplicon sequence variants in a feature table and annotated using the naive Bayes classifier trained on the Silva_132 99% OTUs reference databases. Taxa with a prevalence less than 10% and a relative abundance less than 0.01% were filtered out. The relative abundance of the taxa was transformed using a rank-based inverse normal transformation.
Validation cohort
The ABO cohort was used as the validation cohort. ABO is a nationwide multicentre prospective cohort study that recruited 10,010 participants aged 18–90 years from eight Chinese cities between March 2024 and April 2025, all participants in the health and wellness industry. A subset of 2,749 participants from eastern coastal region of China (two cities: Hangzhou and Shanghai) was selected for validation of the EastDiet. After excluding participants with incomplete or illogical FFQs, implausible energy intake and self-reported cancer and CVDs, 1,851 eligible participants were included in the analysis (Extended Data Fig. 7). In the ABO cohort, study procedures, including standardized questionnaires, FFQ assessments, physical examinations and DXA scans, were implemented using identical protocols to those used in the WELL-China cohort. Consequently, in the ABO cohort, the same set of 22 food groups was used in the clustering. Moreover, the definitions and processing standards for all obesity-related measures and covariates were applied consistently with those in the WELL-China cohort. Ethical approval was obtained from the institutional review boards of the Second Affiliated Hospital of Zhejiang University School of Medicine. All participants provided written informed consent.
Statistical analysis
Continuous variables were summarized as means ± s.d., whereas categorical variables were expressed as counts (percentages). For covariates with missing data (missing data counts: BMI, n = 16; educational, n = 5; smoking, n = 9; physical activity, n = 49), missing values were coded as a separate category for categorical covariates, and median imputation was used for continuous variables to minimize data loss.
Identification of dietary pattern
Dietary data were expressed as the energy contribution (%) of each food item for clustering. To classify individuals into distinct dietary patterns while preserving the interpretability of individual food groups, k-means clustering was performed on the standardized values of the 22 food groups across both the discovery and validation cohorts, respectively. The optimal number of clusters for the k-means analysis was determined on the basis of the silhouette coefficient and the Calinski–Harabasz (CH) index using the NbClust package60. Both indices reached their optimum when n = 2; therefore, the number of clusters was accordingly determined as two, as detailed in Supplementary Fig. 1.
Dietary pattern and health outcomes analysis
HRs and 95% CIs were calculated to explore prospective association of dietary patterns with incident MACE using Cox proportional regression, adjusting for age, sex, residential areas, BMI, education, smoking, physical activity, total energy, nutritional supplement use, history of diabetes, history of hypertension and family history of CVD. The proportional hazard assumption of all Cox models was verified by using the Schoenfeld residual test, with no observed model violation. We evaluated the interaction terms of the EastDiet with sex, age and educational level, followed by stratified analyses. Sensitivity analyses were also conducted: (1) excluding participants who experienced MACE events within the first 1 or 2 years after baseline and (2) redefining MACE by excluding all-cause mortality from its components.
Logistic regression models assessed the cross-sectional associations between dietary patterns and both general and central obesity, with adjustments for age, sex, residential areas, education, smoking, physical activity, total energy, nutritional supplement use and history of diabetes. Associations of dietary patterns with regional fat distribution indices were investigated using multivariate linear regression. We also evaluated the interaction terms of the EastDiet with sex, age and educational level, followed by stratified analyses.
Dietary pattern and metabolomics analysis
Multivariable linear regression models examined the association between the dietary pattern and each metabolite, adjusting for age, sex, residential areas, BMI, education, smoking, physical activity, total energy, nutritional supplement use and history of diabetes and hypertension. High-dimensional tests corrected the P value using the Bonferroni method with a target P-adjusted of 0.05 considered significant per-metabolite test. Identified metabolites were classified on the basis of their assigned subclass in the Human Metabolome Database. Partial Spearman correlation assessed associations of differential metabolites with individual food group intakes, adjusting for age, sex, residential areas, BMI, total energy intake and history of diabetes and hypertension with significance set at 0.05 after the BH correction.
Dietary pattern and gut microbial analysis
The Bray–Curtis dissimilarity was calculated for each participant to determine taxonomy variation. Permutational multivariate analysis of variance (PERMANOVA) was used to test differences in microbial community composition on the basis of Bray–Curtis distances, using the adonis2 function in the vegan package with 999 permutations. The Maaslin2 package identified genera associated with the EastDiet, using the other dietary pattern as the reference, while adjusting for the covariates in the metabolomic analysis and antibiotic use. High-dimensional tests corrected the P value using the BH method with a target P-adjusted of 0.05 considered significant per-genus test. Partial Spearman correlation quantified the associations of identified gut microbial genera with individual food group intakes, adjusting for covariates, with significance set at 0.05 after the BH correction.
Network correlation analysis
Partial Spearman correlation analyses were performed to explore metabolite and microbial genera correlations. A network of all biomarkers with statistically significant and strong correlations (|r| >0.3, BH-adjusted P < 0.05) was constructed.
Within the network, metabolites and gut microbial genera that were significantly associated with the EastDiet were selected for further analysis. Partial Spearman correlation assessed associations of these biomarkers with obesity indices, adjusting for age, sex, residential areas, BMI, total energy intake and history of diabetes and hypertension. The Cox proportional hazards models assessed the associations of these biomarkers with incident MACE, adjusting the same covariates.
All statistical analyses were performed using R version 4.2.2. Statistical significance was defined as a two-tailed P value < 0.05, unless otherwise indicated.
Reporting summary
Further information on research design is available in the Nature Portfolio Reporting Summary linked to this article.
Source link