

Trends in common sexually transmitted infections in the United States, 2018–2022
Recent epidemiological trends highlight a shifting and increasingly concerning burden of STIs across the United States. Chlamydia and gonorrhea continue to be among the most commonly reported communicable diseases nationwide. While chlamydia demonstrated an overall decline of 6.20% over the past five years, it remained relatively stable with a marginal increase of 0.30% in the most recent year (Fig. 1).
Gonorrhea, in contrast, exhibited a five-year increase of 11.10%, despite an 8.70% decrease from 2021 to 2022 (Fig. 1) Syphilis displayed the most dramatic change, with a 78.90% increase over five years and a 17.00% rise in just the last year alone (Fig. 1 and Supplementary Figure S1).
Percent change in reported cases of common Sexually Transmitted Infections (STIs) in the United States, 2018–2022 and 2021–2022
One-year (2021–2022) and five-year (2018–2022) percent changes in reported cases of chlamydia, gonorrhea, and syphilis based on CDC surveillance data. Percent change was calculated relative to case counts in 2018 and 2021, respectively. Syphilis demonstrated the most substantial increase over both time periods. Statistical significance of changes in syphilis rates was confirmed using a z-test for difference in proportions (p < 0.001 for both comparisons).
Geographic distribution of syphilis cases across the United States
Geographic analysis revealed that the highest rates of syphilis including both primary and secondary syphilis as well as congenital syphilis, were concentrated in the Midwest and Southern regions of the United States (Fig. 2). Among these, South Dakota was disproportionately affected, reporting the highest rate of primary and secondary syphilis during the study period.
These findings underscore the need for targeted interventions that account for regional variations in resource availability, healthcare delivery, and social determinants of health.

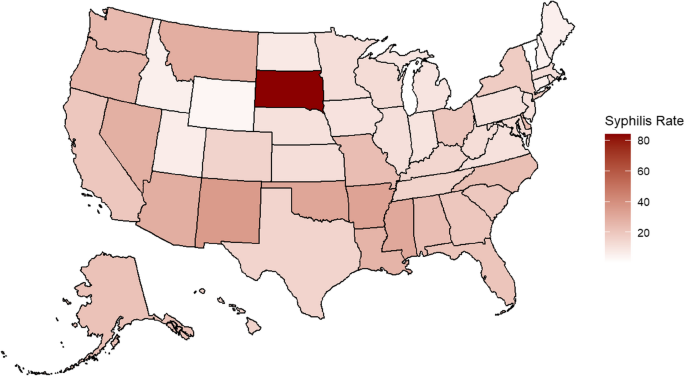
Geographic distribution of syphilis rates by State, United States, 2022
Choropleth map illustrating primary and secondary syphilis rates by state in 2022 based on CDC surveillance data. Darker shading indicates higher rates of syphilis per 100,000 population.
Sex- and age-related patterns of syphilis incidence
Between 2018 and 2022, syphilis cases were consistently higher among males compared to females, reflecting a greater reported burden of infection among males during this period (Fig. 5A). While both sexes experienced an upward trend in case counts over the five-year span, males consistently accounted for a disproportionately greater number of cases. Notably, the number of syphilis cases among females nearly doubled, reflecting a concerning rise in incidence within this group as well.
To further evaluate these trends, syphilis rates were averaged across the five-year period and stratified by age group for each sex. Among both males and females, the 25–29-year-old age group exhibited the highest rates of syphilis during the study period (Fig. 3B and C) In females, greater variability in case rates was observed beginning at age 20, as indicated by wider standard deviations, suggesting potential fluctuations in exposure or testing practices over time.

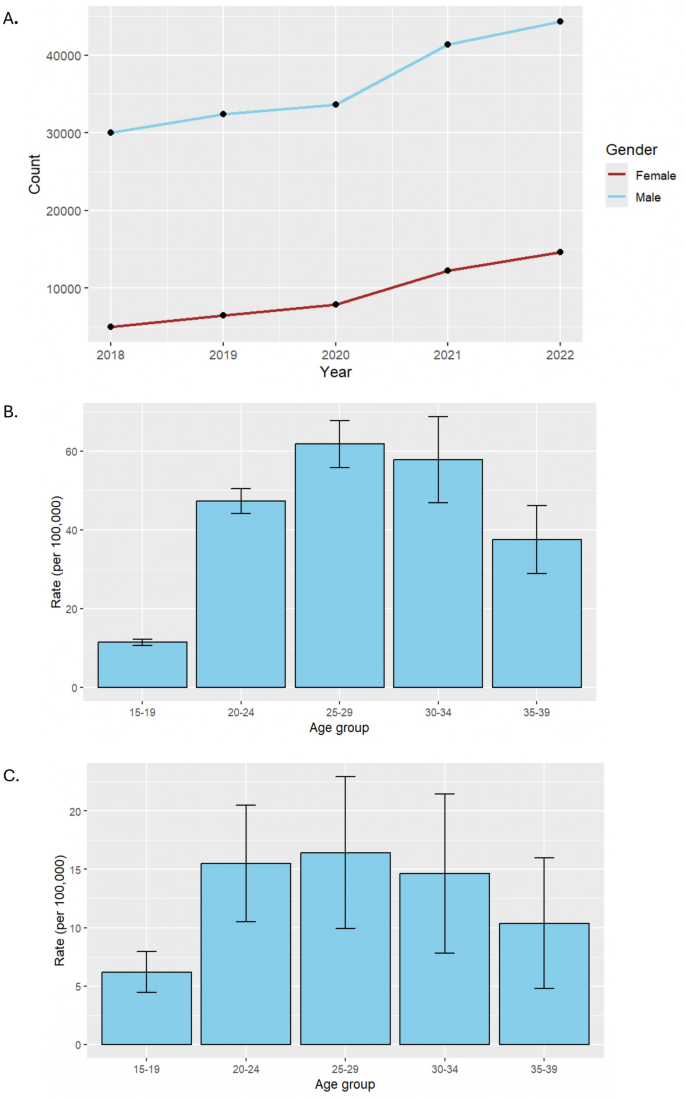
A Annual reported syphilis cases by sex, United States, 2018–2022. B Average Syphilis Rates Among Males by Age Group, United States, 2018–2022. C Average Syphilis Rates Among Females by Age Group, United States, 2018–2022. Trends in reported syphilis case counts from 2018 to 2022, stratified by sex. While males consistently accounted for a higher number of cases each year, the rate of increase among females was more pronounced over the five-year period, with reported cases nearly doubling from 2018 to 2022. “Count” on the Y-axis = Number of reported P&S syphilis cases. Average syphilis rates per 100,000 population among males, stratified by age group, from 2018 to 2022. Error bars represent the standard deviation across annual rates during the five-year period. Average syphilis rates per 100,000 population among females, stratified by age group, from 2018 to 2022. Error bars represent the standard deviation across annual rates during the five-year period
Racial and ethnic disparities in syphilis rates
While all racial and ethnic groups experienced increases in syphilis cases between 2018 and 2022, certain populations bore a disproportionately higher burden of infection. Individuals identifying as Black/African American and American Indian/Alaska Native (AI/AN) exhibited comparable five-year average rates of syphilis. However, in 2022, AI/AN individuals had the highest reported infection rate, which significantly influenced the overall average for this group (Fig. 4).

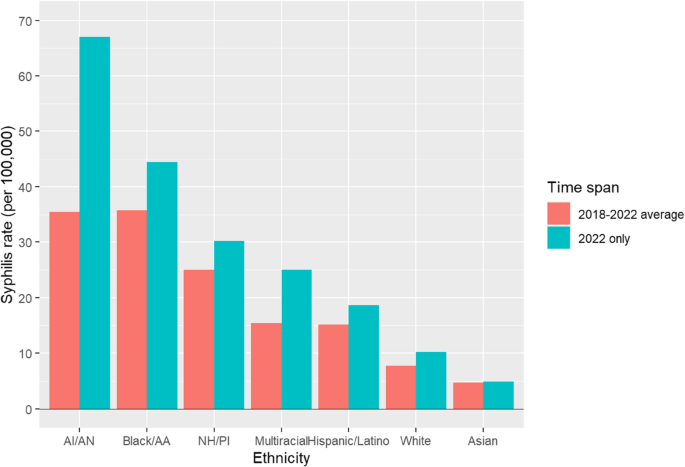
Syphilis rates by race and ethnicity, United States, 2018–2022. Rates of primary and secondary syphilis per 100,000 population among racial and ethnic groups. Bars represent the 2018–2022 average and 2022 rates separately. AI/AN = American Indian/Alaska Native; Black/AA = Black/African American; NH/PI = Native Hawaiian/Pacific Islander
Odds ratio analysis in 2022 demonstrated that AI/AN individuals had the highest likelihood of syphilis infection compared to White Americans (OR: 17.87; 95% CI: 14.01–22.80; p < 0.001), followed by Black/African Americans (OR: 7.03; 95% CI: 5.53–8.94; p < 0.001) (Table 1). All racial and ethnic groups showed significantly elevated odds of infection relative to White Americans, except those identifying as Asian, who had a significantly lower odds of infection (OR: 0.45; 95% CI: 0.32–0.65; p < 0.001).
Syphilis prevalence by sexual behavior characteristics
Between 2018 and 2022, individuals reporting sexual activity with anonymous partners consistently exhibited the highest rates of syphilis, with this behavior associated with the greatest risk of infection in 2022 (OR: 13.1; 95% CI: 9.70–17.72; p < 0.001) (Fig. 5; Table 2). Engaging in sexual activity while intoxicated was also strongly associated with increased risk (OR: 9.49; 95% CI: 6.99–12.83; p < 0.001). In comparison, having sex with a person who injects drugs was associated with a more modest increase in risk (OR: 1.68; 95% CI: 1.17–2.37; p < 0.001).
When evaluated against the reference category of transactional sex (defined as exchanging sex for drugs or money), all other behaviors, including anonymous sex, sex while intoxicated or high on drugs, and sex with a person who injects drugs, were associated with significantly higher odds of syphilis infection.
Moreover, all four behavior categories demonstrated a general upward trend in reported syphilis cases over the five-year period, with certain behaviors, particularly anonymous sexual activity and intoxicated sex, showing more pronounced increases (Fig. 5).

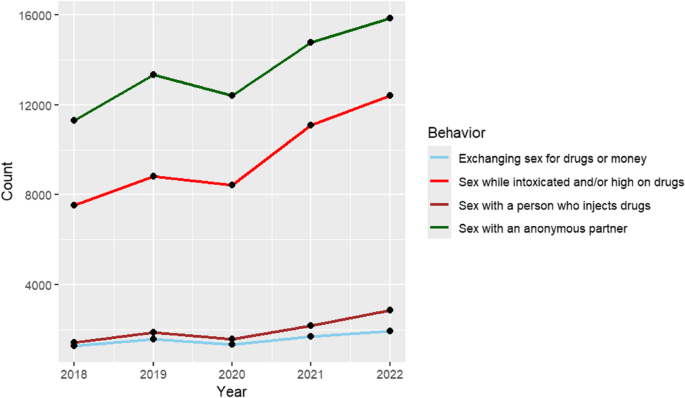
Syphilis cases by reported sexual behaviors, United States, 2018–2022. Total number of reported syphilis cases from 2018 to 2022, stratified by sexual behavior. Sexual behavior categories, as defined by the CDC, include exchanging sex for drugs or money, sex while intoxicated or high on drugs, sex with a person who injects drugs, and sex with an anonymous partner. “Count” on the Y-axis = Number of reported P&S syphilis cases
Association between substance use and syphilis infection
All substance use behaviors depict an increasing trend over the five-year span from 2018 to 2022, further suggesting an increasing prevalence of syphilis (Fig. 6). Individuals who use crack have 38% lower odds of syphilis infection compared to cocaine users (OR: 0.38, 95% CI: 0.35–0.42, P < 0.001) (Table 3). Similarly, heroin use is associated with 43% lower odds of syphilis infection (OR: 0.57, 95% CI: 0.52–0.62, P < 0.001). In contrast, injection drug use is linked to an 89% increase in the odds of syphilis infection (OR: 1.89, 95% CI: 1.77–2.02, P < 0.001). Methamphetamine use shows the strongest association, with users experiencing over three times higher odds of syphilis infection compared to cocaine users (OR: 3.34, 95% CI: 3.13–3.55, P < 0.001). These findings underscore the varying risks of syphilis infection among different substance users, with injection drug use and methamphetamine use being particularly associated with elevated risk.

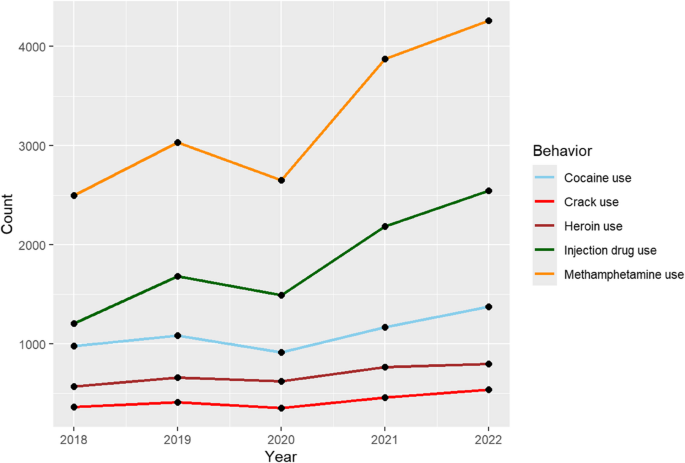
Syphilis rates by reported substance use, United States, 2018–2022. Average syphilis rates per 100,000 population from 2018 to 2022, stratified by reported substance use behavior. Substance use categories, as defined by the CDC, include cocaine, crack, heroin, injection drug use, and methamphetamine use. “Count” on the Y-axis = Number of reported P&S syphilis cases
Syphilis incidence by sex of sexual partner
When stratified by reported sex of sexual partners, men who have sex with men (MSM) consistently accounted for the highest number of syphilis cases from 2018 to 2022 (Fig. 7). While syphilis cases among MSM remained relatively stable over this period, greater year-to-year fluctuations were observed among men who have sex with women only (MSW), men with unknown sex of partners (MSU), and women. Notably, syphilis cases among women showed the greatest variability across the five-year period. The consistently high burden of syphilis among MSM underscores a persistent disparity in this population, which remains a critical focus for targeted public health interventions.

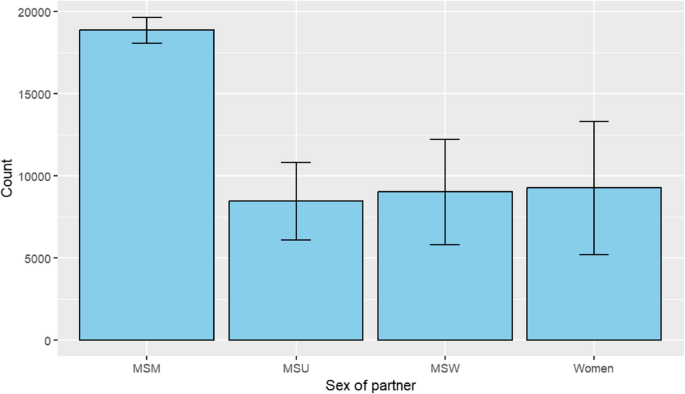
Total reported syphilis cases by sex of sexual partner, United States, 2018–2022. Total number of reported syphilis cases from 2018 to 2022, stratified by sex of sexual partner. Categories, as defined by the CDC, include men who have sex with men (MSM), men who have sex with women only (MSW), men with unknown sex of partners (MSU), and women. Unknown or missing data were excluded. Error bars represent the standard deviation across annual case counts during the five-year period. “Count” on the Y-axis = Number of reported syphilis cases
Source link
-

-

-

-

-


