Study design and patient characteristics
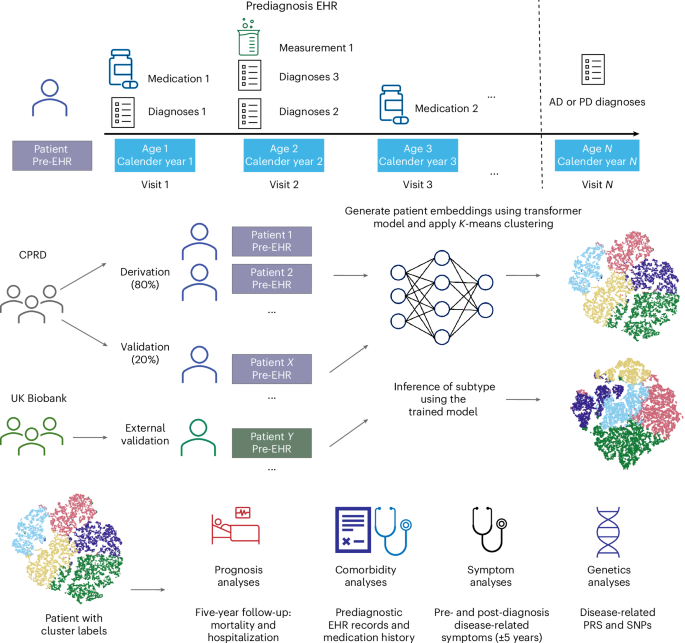
This study utilized CPRD Aurum34 as the primary data source, with UK Biobank35 serving as an external validation set. CPRD Aurum comprises extensive EHR data from UK general practices (GPs), covering approximately 20% of the UK population. The dataset includes patient demographics, clinical diagnoses, prescriptions, test results and lifestyle factors. Furthermore, CPRD is linked to Hospital Episode Statistics (HES) for secondary care data and the Office for National Statistics for mortality records, providing a comprehensive, de-identified dataset of a broad UK population. Refer to Fig. 1 and the Methods for details.
Longitudinal prediagnostic EHRs from the CPRD and UK Biobank were used to subtype AD and PD. Each patient’s time-stamped EHR were tokenized by visit, age and calendar year to construct sequential inputs for a transformer model. Patient embeddings derived from the model were clustered using K-means to identify data-driven subtypes. The CPRD cohort was split into derivation (80%) and validation (20%) sets based on GP identifiers. UK Biobank served as an external validation dataset. Subsequent analyses compared clusters with respect to prognosis (5-year follow-up for mortality and hospitalization), comorbidities (prediagnostic EHR records and medication history), symptoms (pre- and post-diagnosis disease-related symptoms within ±5 years) and genetics (disease-related PRS and SNPs).
A total of 228,637 and 4,623 AD cases were identified in CPRD and UK Biobank, respectively, of which 113,545 and 3,710 patients met our inclusion criteria. For PD, CPRD and UK Biobank contained 95,408 and 4,685 cases, respectively, of which 45,825 and 3,732 patients were ultimately selected (see selection diagrams in Supplementary Figs. 1–4).
The AD cohort’s mean ages at diagnosis were 82.1 years (standard deviation (s.d.) 8.0) in CPRD and 74.4 years (s.d. 5.5) in UK Biobank. Females accounted for 63.8% of the CPRD cohort and 52.1% of the UK Biobank cohort. The cohorts were predominantly white (93.6% CPRD, 91.3% UK Biobank), with 22.3% (CPRD) and 34.5% (UK Biobank) classified as Index of Multiple Deprivation36 (IMD) category 1 (most deprived areas). Notably, 0.2% of patients with AD in CPRD and 0.1% in UK Biobank were aged between 40 and 50 years. In addition, 64.9% of CPRD patients were over 80 years old, compared with only 14.9% in UK Biobank.
In the PD cohorts, the mean ages at diagnosis were 77.8 years (s.d. 9.3) in CPRD and 70.6 years (s.d. 7.2) in UK Biobank, with females constituting 40.6% and 37.1% of the CPRD and UK Biobank cohorts, respectively. White individuals represented 93.3% of the CPRD and 90.7% of the UK Biobank cohorts. IMD category 1 was reported for 23.78% of CPRD and 37.88% of UK Biobank participants. Among PD patients aged 40–50 years, 0.93% were recorded in CPRD and 0.96% in UK Biobank. In addition, 45.11% of CPRD patients were older than 80 years, in contrast to only 5.84% in the UK Biobank cohort (Supplementary Table 1).
Model validation and clustering stability
We used each patient’s prediagnostic EHR as input in this study. Patients contributed long prediagnostic observation periods, with median (interquartile range (IQR)) durations of 18.9 (7.9–31.1) years for AD and 19.1 (9.1–30.6) years for PD in CPRD, and 35.0 (21.0–53.0) years for AD and 30.0 (19.0–49.0) years for PD in UK Biobank (Supplementary Tables 2 and 3).
To cluster patients into different subtypes, we first transformed EHR data into vector representations using a transformer-based model33. Subsequently, we performed K-means clustering on the generated hidden representations through prediction strength analysis37 (Methods). Using the prediction strength threshold of 0.95, we identified five clusters each for AD and PD.
The t-distributed stochastic neighbor embedding plots demonstrated clear cluster separation across the derivation, internal validation and UK Biobank datasets (Supplementary Figs. 5 and 6), with corresponding prediction strength plots in Extended Data Figs. 1 and 2. Assignment confidence distributions (Methods) further supported subtype cohesion, with most patients showing high alignment to their assigned cluster (Extended Data Figs. 3 and 4 and Supplementary Tables 4 and 5). In addition, we reported the other commonly used clustering metrics in Supplementary Tables 6 and 7, which consistently supported the robustness and validity of the identified clusters.
To benchmark performance, we compared our transformer-derived embeddings against two baseline representations: (1) term frequency–inverse document frequency with K-means clustering, and (2) a clinical-variable baseline including age, sex, IMD, calendar year, visit frequency and Charlson Comorbidity Index (CCI). The best-performing clusters from each baseline model, compared with our transformer-based approach, are summarized in Supplementary Table 8, demonstrating our model’s substantially superior clustering stability and reproducibility across all evaluation metrics.
Five subtypes of AD and PD
We assigned descriptive labels to each subtype based on their predominant clinical and genetic features (see Fig. 2a–d for the cluster distribution). Cluster-wise baseline characteristics in the CPRD validation set are summarized in Table 1, and for the UK Biobank cohort in Supplementary Tables 9 and 10.

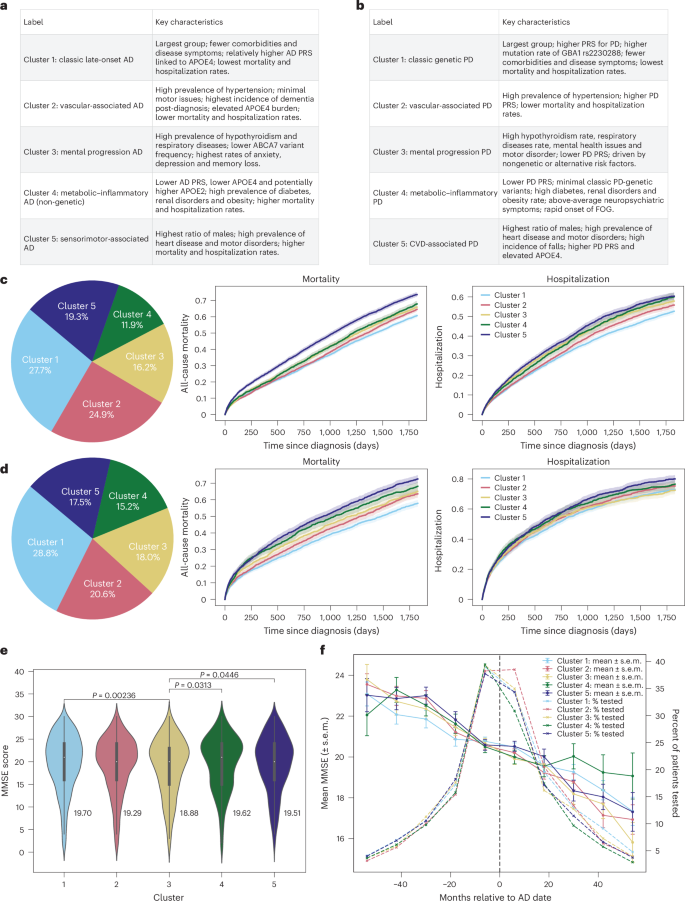
a,b, Cluster labels and main characteristics for both AD (a) and PD (b). c, AD population distribution on CPRD validation dataset (total n = 22,664), 5-year mortality and hospitalization rates for AD, mortality global log-rank P = 2.7 × 10−50; hospitalization global log-rank P = 3.0 × 10⁻¹⁸. d, PD population distribution (total N = 8,946), mortality global log-rank P = 2.1 × 10⁻²⁴; hospitalization global log-rank P = 1.5 × 10⁻⁴. Solid lines represent the estimated survival or hospitalization rates, and shaded regions represent the 95% CIs (c and d). e, AD 5-year post-diagnosis mean MMSE scores across clusters. Data are shown as violin plots, with a narrow box-and-whisker overlay indicating the median (center line), upper and lower quartiles (box limits) and whiskers extending to ±1.5× the IQR; individual points beyond the whiskers represent outliers. Statistical differences between clusters were assessed using two-sided Mann–Whitney U tests. Number of samples: cluster 1, 1,618; cluster 2, 1,435; cluster 3, 863; cluster 4, 545, cluster 5, 989. f, The 10-year MMSE scores trend; the bars represent mean ± standard error of mean (s.e.m.) at each point. The dotted line represents AD diagnoses. Sample size per cluster (patients with more than one MMSE in 10 years): cluster 1, 1,767; cluster 2, 1,623; cluster 3, 1,046; cluster 4, 768, cluster 5, 1,179.
Source data
For AD, the clusters represented subtypes such as classic late-onset presentation (cluster 1), vascular-related patterns (cluster 2), neuropsychiatric dominance (cluster 3), metabolic–inflammatory profiles (cluster 4) and sensorimotor pattern (cluster 5). For PD, the clusters included classic genetic PD (cluster 1), vascular-associated types (cluster 2), severe neuropsychiatric forms (cluster 3), metabolic–inflammatory phenotypes (cluster 4) and cardiovascular–motor subtypes (cluster 5). We further identified the top 1% of patients closest to each cluster centroid (prototype patients), representing the most typical individuals, and summarized their demographic profiles and the most frequent clinical features (Supplementary Tables 11 and 12) to provide concrete clinical snapshots of each subtype.
Among the five AD subtypes, cluster 1 was the largest, comprising 27.7% of CPRD patients and 37.7% of UK Biobank patients. Clusters 1–3 were predominantly female, whereas cluster 5 included more male patients (58.8% in CPRD and 71.4% in UK Biobank). Cluster 4 showed a more balanced sex distribution (55.3% female in CPRD and 46.2% in UK Biobank). Age differences across AD clusters were relatively small: the largest mean age difference was 3.1 years in CPRD (cluster 1 versus cluster 2) and 2.2 years in UK Biobank (cluster 1 versus cluster 5). Notably, clusters 1 and 3 included the highest proportion of patients under 60 years of age.
For PD, cluster 1 was the most prevalent, representing 28.8% of CPRD and 40.0% of UK Biobank patients. Clusters 1, 2, 4 and 5 were predominantly male, while cluster 3 showed a balanced sex ratio (51.6% female in CPRD; 51.4% in UK Biobank). Age differences across PD clusters were modest: the largest mean age difference was 5.4 years in CPRD and 5.0 years in UK Biobank (both between cluster 1 and cluster 5). Only clusters 1 and 3 included patients under the age of 50. The detailed age distribution can be found in Supplementary Figs. 7–10.
Clusters (both AD and PD) differed in prediagnostic visit frequency and EHR density (all Kruskal–Wallis P < 0.0001), reflecting expected variation in healthcare utilization and disease complexity. However, GP-level effects were minimal (intraclass correlation coefficient 0.012 for PD and 0.008 for AD), indicating that <1% of cluster variance was attributable to GP practice (Supplementary Tables 13 and 14).
Mortality and hospitalization
We observed differential mortality and hospitalization rates across the five identified subtypes (Fig. 2c). For patients with AD, cluster 1 had the lowest mortality and hospitalization rates, approximately 55% 5-year mortality and 50% hospitalization. This was followed by cluster 2, which comprised the oldest group in CPRD (mean age 83.6). Cluster 5 had the highest 5-year mortality and hospitalization rates. Mapping the clusters to the UK Biobank data revealed similar outcomes ranking among patient groups (Supplementary Fig. 11), with the exception that cluster 4 showed the highest mortality and hospitalization rates.
For patients with PD, cluster 1 similarly had the lowest mortality and hospitalization rates, approximately 50% for 5-year mortality and 65% for hospitalization. It was followed by cluster 2, which was the second-oldest group in CPRD (mean age 79.2). Cluster 5 recorded the highest 5-year mortality and hospitalization rates (Fig. 2d). Validation in UK Biobank data showed comparable trends (Supplementary Fig 12), although cluster 4 also had the highest mortality and hospitalization rates.
Kaplan–Meier curves showed significant differences in 5-year all-cause mortality and hospitalization across clusters (global log-rank P < 0.001; see Supplementary Tables 15–18 for pairwise results). Survival results remained consistent after multivariable adjustments for age, sex, IMD, calendar year, care intensity and recent comorbidity burden (2-year CCI), confirming that cluster–outcome associations were robust to demographic and healthcare use differences (Supplementary Tables 19 and 20). However, for PD, cluster membership was not significantly associated with hospitalization risk after adjustment.
Subtype-specific comorbidities
We summarized each subtype’s comorbidities to illustrate comorbidity heterogeneity (Fig. 3a for AD and Fig. 4a for PD). In addition to prevalence-based comparisons, we used weighted discriminative scores (WDS) to highlight codes that best distinguish each subtype. For each cluster, we visualized the top five discriminative diagnosis and medication codes using radar plots (Supplementary Figs 13 and 14).

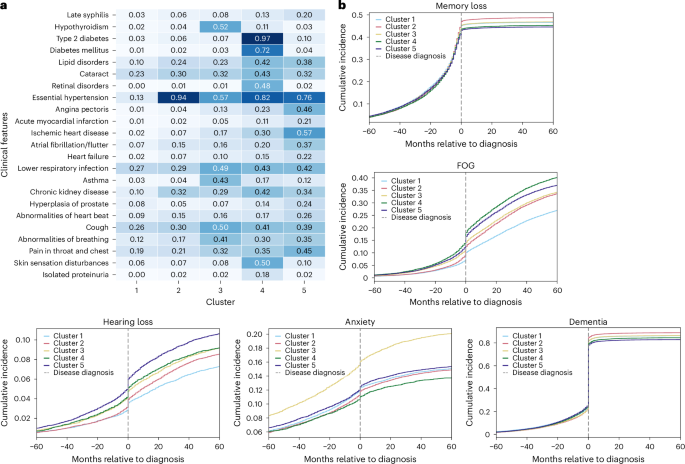
a, Heatmap comorbidities for patients with AD, showing diseases with more than 15% variance across clusters in the CPRD validation dataset. Numbers in the heatmap represent the percentage of individuals within each cluster who have the corresponding diagnosis, normalized by the total number of individuals in that cluster. The color scale reflects the proportion (0–1) of individuals within each cluster with the corresponding diagnosis. b, Ten-year prevalence (5 years pre- and 5 years post-diagnosis) of symptoms for AD.

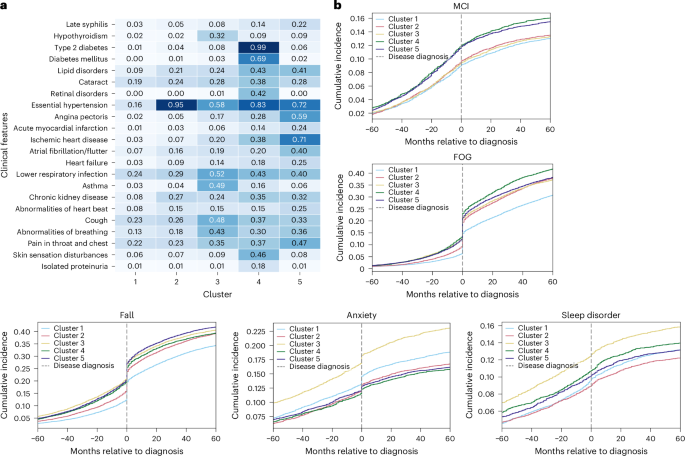
a, Heatmap comorbidities for patients with PD, showing diseases with more than 15% variance across clusters in the CPRD validation dataset. Numbers in the heatmap represent the percentage of individuals within each cluster who have the corresponding diagnosis, normalized by the total number of individuals in that cluster. The color scale reflects the proportion (0–1) of individuals within each cluster with the corresponding diagnosis. b, Ten-year prevalence (5 years pre- and 5 years post-diagnosis) of symptoms for PD. MCI, mild cognitive impairment.
For patients with AD, cluster 1 was characterized by low prevalence across all common diseases. Cluster 2 was predominantly defined by essential hypertension, affecting 94% of patients. Cluster 3 featured a high prevalence of hypothyroidism (52%) and respiratory diseases. Cluster 4 had notably high rates of diabetes (97%), renal disorders and skin sensation disturbances (50%), while cluster 5 was distinguished by cardiovascular diseases and a notable high 20% prevalence of late-stage syphilis. Validation with UK Biobank showed similar dominant comorbidities, except that skin sensation disturbances and late-stage syphilis were absent from clusters 4 and 5. Instead, musculoskeletal symptoms (32%) and gastrointestinal disorders (44%) emerged as secondary important comorbidities (Supplementary Fig 15). Radar plots were consistent with these dominant patterns: for example, essential hypertension, cognitive symptoms and diabetes-related medication codes were consistently top-ranked by WDS across cluster 2 and cluster 4, while cluster 3 stood out with high-ranking respiratory and thyroid-related features.
For patients with PD, the clustering revealed dominant predisease comorbidity profiles that closely mirrored those seen in the AD population. Within clusters, the dominant comorbidities were largely consistent between CPRD- and UK Biobank-derived profiles, with gastrointestinal disorders (52%) appearing as secondary important comorbidities in cluster 5 (Supplementary Fig 16). The radar plots are also consistent with these findings, highlighting distinct subtype signatures such as the hypertension-dominant profile in cluster 2 and the cardiovascular–motor pattern in cluster 5.
Subtype-specific patterns of disease-related symptoms
To better understand early signals and disease progression, we examined 10-year trajectories of disease-related symptoms for each cluster, spanning from 5 years before to 5 years after disease onset. This highlighted early differences between disease subtypes and provided insights into how clinical symptoms evolve over time.
Among AD clusters, cluster 3 exhibited the highest incidence of depression and anxiety, highlighting a predominance of mental health problems. In addition, analyses of post-5-year mean Mini-Mental State Examination (MMSE) scores (Supplementary Tables 21 and 22) suggested that cluster 3 had notably lower performance, and the 10-year MMSE trend further revealed a slightly faster cognitive decline in cluster 3 compared with other clusters (Fig. 2e,f and Supplementary Fig 17). Clusters 4 and 5 experienced prominent motor disorders, including falls (Supplementary Fig 18), freezing of gait (FOG) and hearing loss. All clusters displayed high rates of memory loss and dementia (>80% dementia incidence post-diagnosis), with cluster 2 showing slightly higher and clusters 4 and 5 marginally lower prevalences (Fig. 3b).
In the PD cohorts, cluster 3 showed the most severe PD symptoms. It similarly demonstrated elevated anxiety and depression (Supplementary Fig. 19), alongside greater severity of motor-related symptoms, such as falls, FOG and sleep disorders, both before and after disease onset. In addition, cluster 3 patients exhibited earlier tremor symptoms (Supplementary Fig 20), up to 3 years before PD diagnosis. As for falls and FOG, cluster 3 initially had a higher presymptomatic prevalence, whereas cluster 4 experienced the most rapid progression of FOG post-diagnosis, followed closely by cluster 5. A similar pattern emerged for falls, with cluster 3 showing early signs and cluster 5 progressing more rapidly after diagnosis. In addition, clusters 4 and 5 displayed a higher prevalence of cognitive impairments (Fig. 4b), with cluster 5 also showing an increased prevalence of dementia (Supplementary Fig. 21).
Genetic explanations of subtypes
To investigate the genetic underpinnings of the identified phenotypes, we conducted two types of comparison using disease-specific polygenic risk scores (PRS): pairwise comparisons between each cluster and all other clusters and the control group individually, and ‘1 versus others’ comparisons where each cluster was contrasted with all other clusters combined (for example, cluster 1 versus clusters 2–5). The control group consisted of Caucasian individuals without a diagnosis of AD or PD in the UK Biobank.
As shown in Fig. 5a, for AD, all clusters exhibited significantly higher AD PRS scores than controls (mean PRS −0.01). Specifically, cluster 4 demonstrated a notably lower AD PRS score (mean 0.58) relative to each of the other clusters (cluster 1 mean: 0.99, P < 0.0001, cluster 2 mean: 0.99, P < 0.0001, cluster 3 mean: 0.99, P < 0.0001; cluster 5 mean: 0.89, P < 0.0001). Conversely, cluster 1 (Fig. 5c) showed a significantly higher PRS compared with the other cluster PRS (P = 0.0034). In addition, when comparing other conditions’ PRS scores across clusters (Supplementary Fig. 22), cluster 2 had elevated risks for hypertension and stroke; cluster 3 showed increased risks for asthma and rheumatoid arthritis; cluster 4 exhibited higher risks for type 1 and type 2 diabetes; and cluster 5 presented increased cardiovascular disease (CVD) risk.

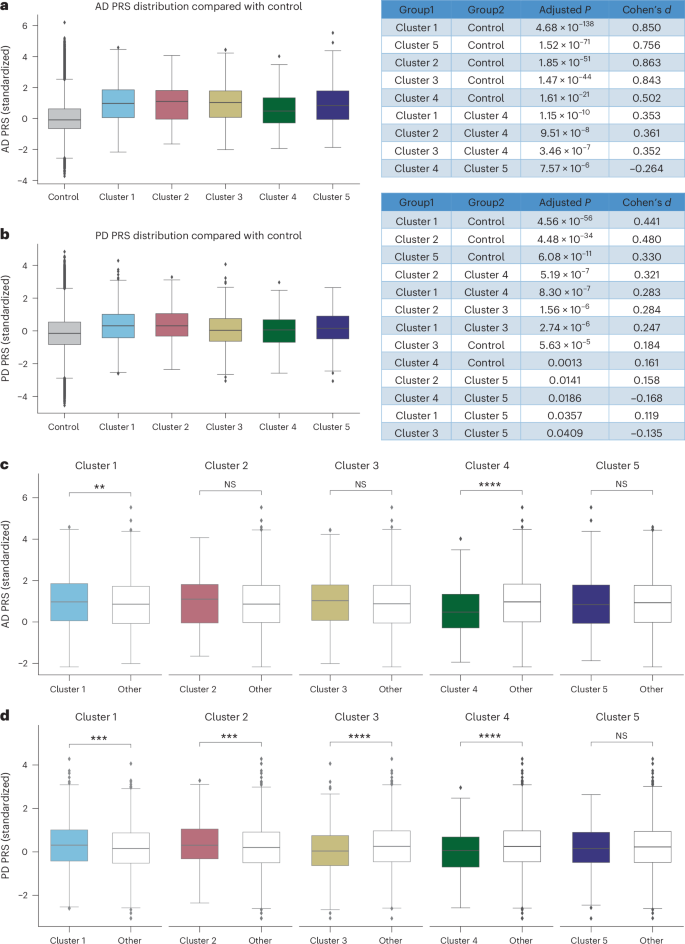
a,b, The distribution of AD (a) and PD (b) PRS across the five clusters relative to controls. Pairwise comparisons were performed using two-sided t-tests with Benjamini–Hochberg FDR correction; exact P values and effect sizes (Cohen’s d) are provided in the figures. c,d, ‘One-versus-all’ PRS comparisons for AD (c) and PD (d), where each cluster is contrasted with all other clusters combined using two-sided t-tests. P values for AD comparisons are as follows: cluster 1 (P = 0.003), cluster 2 (P = 0.109), cluster 3 (P = 0.149), cluster 4 (P = 2.14 × 10⁻¹¹) and cluster 5 (P = 0.468). P values for PD comparisons are as follows: cluster 1 (P = 0.0001), cluster 2 (P = 0.0004), cluster 3 (P = 2.40 × 10⁻⁵), cluster 4 (P = 7.07 × 10⁻⁶) and cluster 5 (P = 0.390). For all box plots, the center line represents the median, box limits represent the upper and lower quartiles, and whiskers extend to 1.5× the IQR; points beyond whiskers indicate outliers. AD PRS analysis (a and c): control (n = 482,375), cluster 1 (n = 1,346), cluster 2 (n = 476), cluster 3 (n = 435), cluster 4 (n = 460), cluster 5 (n = 837); PD PRS analysis (b and d): control (n = 482,343), cluster 1 (n = 1,441), cluster 2 (n = 729), cluster 3 (n = 550), cluster 4 (n = 435), cluster 5 (n = 431). *P < 0.05, **P < 0.01, ***P < 0.001, ****P ≤ 0.0001. NS, not significant.
Source data
For PD, all clusters displayed significantly higher PRS scores than controls (mean −0.12), although clusters 3 (mean 0.05) and 4 (mean 0.02) had significantly lower scores relative to the other clusters (Fig. 5b). Similar to AD, PRS scores for other diseases align with each cluster’s dominant comorbidities (Supplementary Fig 23). The ‘1 versus others’ analysis across PD clusters (Fig. 5d) revealed substantial variability in PD PRS, with clusters 1, 2, 3 and 4 each exhibiting significant differences.
To further explore subtype-specific genetic differences, we conducted two complementary single-nucleotide polymorphism (SNP) analyses. First, we performed additive logistic regression to model the association between minor-allele dosage (0, 1 and 2) and cluster membership (‘1 versus others’), adjusting for age, sex and the first three genetic principal components (GPC1–GPC3). Second, we conducted exploratory pairwise Fisher’s exact tests to directly compare carrier status between all cluster combinations. Because sample sizes varied across comparisons, no multiple-testing correction was applied for these descriptive contrasts.
In AD, additive logistic regression analyses (Supplementary Table 23) identified significant differences for APOE4 (rs429358_C; cluster 4, odds ratio (OR) 0.62, 95% confidence interval (CI) 0.53–0.74, Bonferroni P = 1.9 × 10⁻⁶) and APOE2 (rs7412_T; cluster 4, OR 1.80, 95% CI 1.30–2.49, Bonferroni P = 0.011), as well as ABCA7 (rs3764650_G; cluster 1, OR 1.29, 95% CI 1.11–1.51, Bonferroni P = 0.032). Exploratory pairwise Fisher’s exact tests (Supplementary Table 24) corroborated these results, showing APOE4 depletion and APOE2 enrichment in cluster 4 (for example, cluster 4 versus cluster 5: OR 0.71, P = 0.004; cluster 4 versus 5 for APOE2: OR 1.38, P = 0.025) and ABCA7 excess in cluster 1 versus 3 (OR 1.51, P = 0.005). Cluster-specific carrier enrichment (Supplementary Fig 24) further visualized these trends, with reduced APOE4 (rs429358_C) and increased APOE2 (rs7412_T) in cluster 4, consistent with a protective APOE2 profile.
In PD, no variants remained significant after Bonferroni correction for regression analyses (Supplementary Table 25), although nominal associations were observed for LRRK2 (rs34637584_A; cluster 2, OR 2.65, 95% CI 1.02–6.88, P = 0.046) and APOE4 (rs429358_C; cluster 4, OR 0.79, 95% CI 0.64–0.98, P = 0.035). Pairwise comparisons (Supplementary Table 26) and carrier enrichment (Supplementary Fig. 25) indicated consistent patterns: LRRK2 enrichment in cluster 2 and relative depletion of APOE4 in cluster 4.
Source link
-

-

-

-

-